
Jailing up, crime down: citizens pay through the nose
By Stephen King, Adjunct Professor, Monash University, and Commissioner with the Productivity Commission
Across Australia, the rate of imprisonment has climbed by about 25% in the past decade, over a time in which the rate of offending has dived 18%.
How can it be that we have less crime but more people in prison?
It’s the conundrum at the heart of a Productivity Commission research paper released recently, entitled Australia’s Prison Dilemma.
This graph presented in the report uses homicides as an indicator of trends in the incidence of violent crime because almost all homicides are reported to police.
Homicides and imprisonment per 100,000 Australians
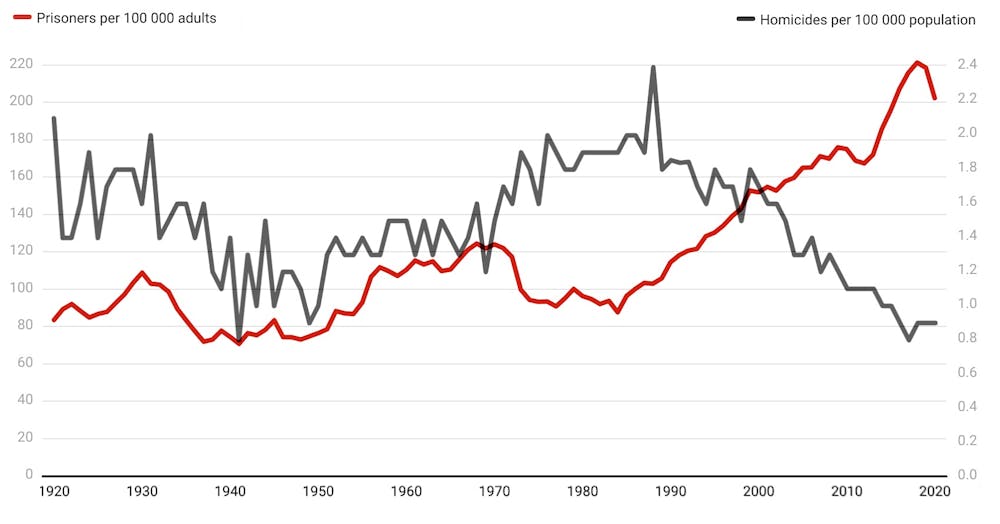
Number of prisoners per 100 000 population aged 18 years and over, number of
homicides per 100 000 persons. Productivity Commission
The apparent fall in imprisonment during the pandemic may not last. It appears to be due to COVID-related decisions to release more unsentenced prisoners on bail, and slowdowns in court processing during lockdowns.
Competing explanations
One obvious – but incorrect – explanation for rising imprisonment at a time of falling crime might be that rising prison numbers are deterring crime. But the best evidence from Australia and overseas shows little if any such connection.
Another might be that “tough on bail” laws are leading to more people being held in prison awaiting trial. Even if some are later found not guilty or are not sentenced to prison, such a change could push up prison numbers while total crime is falling.
Or it might be that “tough on crime” policies are making us send people to prison for crimes that previously would have led to a fine or suspended sentence.
Or we might have increased sentences – imposing more time for the same crime.
Our research finds the correct answer is “all of the above”, with the key driver across Australia being changes that are “tough on crime”.
The biggest drivers of increased prisoner numbers across Australia are the chance that a person who is found guilty is imprisoned and the length of the term. Both have been increased by new policies that mandate prison sentences for certain crimes, eliminate suspended sentences, and make it harder to get parole.
Toughness is understandable
The changes might be appropriate. Perpetrators of violent crime can destroy lives, and they make up almost 60% of the prison population.
However, a lot of prisoners have committed more minor offences with little risk of harm to others. More than one third of prisoners have sentences of less than six months and 60% have been in prison before.
Many of the repeat prisoners are stuck on a treadmill of prison, minor crime, prison with untreated drug or alcohol problems, untreated mental illness, and few if any employment prospects.
Locking up low level offenders just to have them churn through prison again and again is costly.
Toughness is expensive
On average, we find imprisonment costs taxpayers about $120,000 for each prisoner each year. That’s about $5.2 billion in total.
We find that if Australia’s imprisonment rate had remained steady, rather than climbing for 20 years, the saving in prison costs would approach $13.5 billion.
And we find that if we could focus on alternatives for just the 1% of prisoners who create the least risk to society we would save about $45 million per year.
Australia already uses alternatives. Among them are home detention with electronic monitoring, and diversion programs where offenders receive community-based treatment for their addiction or illness.
The alternatives are cheap
These alternatives save money. Community corrections programs cost 1/10th of prison terms. They can also lead to better outcomes, for both the offender and for society, by getting prisoners off the prison-crime-prison treadmill.
They do heighten some risks, but a careful choice of the offenders offered the alternatives along with strong supervision using modern technology, and the knowledge that prison awaits those for whom the alternatives don’t work means the risks can be kept small.
This article first ran on The Conversation: https://tinyurl.com/ee9n98nv
ENDS
The Productivity Commission will hold a webinar on ‘Australia’s Prisoner Dilemma’ on Friday 12 Nov from 2.30pm–4pm. Register here: https://kapara.rdbk.com.au/landers/ff30be.html
SOME snippets from the Productivity Commission report:
Rising imprisonment is costly
Rising imprisonment rates have increased the fiscal costs of running the criminal justice system. Real government expenditure on corrective services grew by 40% over the seven years to 2019‑20. Between 2011‑12 and 2019‑20, government expenditure on prisons as a percentage of total government expenditure grew in all jurisdictions except NSW (chapter 3).
Prison is an expensive sentencing option, with expenditure per prisoner per day ranging from $294 to $559 across Australian jurisdictions in 2019‑20. The average daily cost of keeping an offender in prison is about 10 times the cost of a place in a community corrections program (chapter 3).
– page 12
A third of the prison population is on remand, awaiting trial or sentencing. This proportion has almost doubled since 2000. The average time spent on remand has increased to 5.8 months in 2020 from 4.5 months in 2001.
– page 19
The Northern Territory has the highest overall imprisonment rate in Australia and stands as an outlier compared to other states and territories (ABS 2020b). The NT’s imprisonment rate is higher than that of the United States, which has the highest imprisonment rate of any country in the world (Institute for Crime and Justice Policy Research 2021).
– page 25
While Australia’s imprisonment rate is just above the OECD average, imprisonment growth in Australia is high by international standards. The rate of increase in Australia’s imprisonment rates between 2003 and 2018 was among the fastest in the OECD at 39%. Only Turkey (120%) and Colombia (46%) experienced faster growth in imprisonment between. By contrast, the imprisonment rate grew by 29% in New Zealand, and fell by 1% in Canada and the United Kingdom, and by 14% in the United States over a similar period.
– page 28
Nevertheless, sentence lengths appear to be increasing over time. The median sentence length has increased by 46% since 2011‑12, from six months in 2011‑12 to 8.8 months of imprisonment in 2019‑20 (ABS 2020a). The mean sentence length has increased by 20% since 2011‑12, from 13 months in 2011‑12 to 15.6 months in 2019‑20 (ABS 2020a).
– page 38
- The average dollar value of harm from specific offences. For example, estimates of harm vary from about $3 million for homicide, $65 000 for assault resulting in hospitalisation, $2500 for burglary and $7300 for vehicle theft (QPC 2019, chap. 7; Smith et al. 2014).
– page 52
… the share of prison costs in budgets has increased in several jurisdictions
In 2019-20, prison costs as a share of state and territory governments’ budgets were highest in WA and the NT.
Moreover — with NSW as an exception — the fiscal costs of prison have generally increased as a proportion of state and territory budgets over the past decade). This change has been more pronounced in the NT (where prison costs as a proportion of that Territory’s budget has increased from 2.2% to 3.2% over that time).
These jurisdictional trends are also broadly reflected in differences in average annual growth in real prison costs, with Victoria (7.3%), the NT (7.0%) and SA (4.5%) sitting above the national average annual growth rate of 4.5% (table 3.1).
– page 57
In Australia, the differences in prisoners’ health from the general population is most notable for mental health. For instance, an Australian Institute of Health and Welfare survey of prisoners indicated a mental ill-health prevalence of about 40% compared to 22% in the general population (AIHW 2019a).
– page 66
Court processing times have increased
Increases in court processing times are likely to be contributing to the increase in the remand population. The median time to process cases increased from 5 to 6 weeks in the magistrates courts and from 29 to 36 weeks in the higher courts between 2010‑11and 2018‑19. Median court duration increased across most jurisdictions, except for the ACT (in the higher courts) and NSW, the NT and Victoria (in the magistrates courts). A similar pattern is observed for mean court duration — the mean time to process cases increased from 15 to 16 weeks in the magistrates courts and from 40 to 49 weeks in the higher courts between 2010‑11 and 2018‑19.
– pages 119 & 120
In December 2020, there were 18 000 people on parole in Australia (ABS 2021a), the highest number on record. The period before parole is allowable and the terms on which it is provided affect the total prisoner population because they can reduce the impact of the initial sentence length.
The use of parole varies widely by jurisdiction (figure B.9). The ratio of people on parole to the number of prisoners fell by a sizable amount in Victoria and the ACT and a smaller amount in SA and Tasmania between 2011 and 2019.
– page 127
Although it is not possible to be certain, the increasing rate of recidivism could be indicative evidence that reoffending patterns are playing a role in increasing Australia’s rate of imprisonment. For example, from 2012 to 2019, the number of people in Australian prisons who had a prior spell of imprisonment grew by about 55% whereas the number of people with no prior spell only grew by about 36%. In NSW, a similar trend in reoffending increased the likelihood of a prison sentence, and placed upward pressure on prisoner numbers (Weatherburn 2020).
– page 129
SEE ALSO: Inquiry into imprisonment and recidivism, by the-then Qld Productivity Commission (now the Office of Productivity and Red Tape Reduction in Qld Treasury.
(see especially: Qld Govt response)