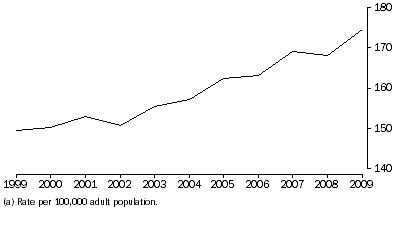
 You’d think, from all the posturing by Law & Order (LO) politicians through Australia, that crime was up, but it is down. But what’s really up is the prison population, by 36% (or 7759) from 21,358 to 29,317 over the past 10 years. At nearly $100,000 per prisoner, it’s costing taxpayers about $800 million a year extra because pollies want to make big fellas of themselves in newspaper headlines.
And still the prison population rises…
Between June 1999 and June 2009, the number of prisoners in Australia increased by 36%.
That is, we jailed an extra 7779 people – or 780 a year more each year – taking the numbers in jail from 21,538 to 29,317.
Over the same period, the number of male prisoners increased by 35% (from 20,181 to 27,192) and the number of female prisoners increased by 57% (from 1,357 to 2,125).
This steep rise occurred as crime trended down significantly (see related article).
And still the prison population rises…with taxpayers footing the bill at a rate of about $98,000 per prisoner per year. Prisons cost us more than $2.5bn annually.
Last year, Australia’s total prisoner population increased by 6%, from 27,615 on 30 June 08 to 29,317 on 30 June 09, greater than the 1% (391) increase recorded between 2007 and 2008.
Between the 2008 and 2009 Prisoner Census dates:
- the number of male prisoners increased by 6% (1,534) whilst the number of female prisoners increased by 9% (168); and
- the number of Indigenous prisoners increased by 10% (680);
Last year, WA and the NT jailed more people proportionately (17% and 11% respectively) and continued to have the highest imprisonment rates (260 and 660 prisoners per 100,000 adults respectively).
Indigenous prisoners comprised a quarter (25% or 7,386) of the total prisoner population: Indigenous people comprise less than 3% of the Australian population.
The comparative rate for Indigenous prisoners was 1,891 per 100,000 adult Indigenous population. The rate of imprisonment for Indigenous prisoners was 14 times higher than the rate for non-Indigenous prisoners at 30 June 2009. In 2008 this difference was 13 times higher for Indigenous prisoners.
The highest ratio of Indigenous to non-Indigenous imprisonment rates in Australia was in Western Australia (20 times higher for Indigenous prisoners). Tasmania had the lowest ratio (three times higher for Indigenous prisoners
Average sentence across the board was 4.8 years, with an average expected time to serve (the earliest date of release taking into account the type of sentence, good behaviour, time already served, etc) of 3.5 years.
Of the total prisoner population, 7% (2,125) were female and more than 8 in 10 (81% or 23,642) were born in Australia. The median age of all prisoners was 33.4 years, unchanged from 2008.
At 30 June 09, the NT continued to have the highest imprisonment rate at 658 prisoners per 100,000 adult population. All states and territories except Queensland and the ACT recorded increased imprisonment rates in the 10-year period from 1999.
Tasmania recorded the largest percentage increase over that period, rising 45% (from 96 prisoners per 100,000 adult population to 140 prisoners per 100,000 adult population). This was followed by the NT, up 44% (from 456 to 658) and South Australia, up 29% (from 120 to 155).
The ACT’s imprisonment rate decreased by 8% between 1999 and 2009 (from 81 to 75 prisoners per 100,000 adults), followed by Queensland which dropped 6% (from 179 to 168).
4517.0 – Prisoners in Australia, 2009 http://www.abs.gov.au/ausstats/abs@.nsf/Latestproducts/4018E1E79924180CCA257687001CC2FC?opendocument
How much do all these prisoners cost?
A study by the Productivity Commission showed that, in 2007-8, prisoners cost an average of $269 per day in Australia…or $98,000 each per year.
National expenditure per person in the population – that is, what it costs each Australian – increased in real terms over five years to 2007-8 by 15%.
The same report showed that, nationally, prison utilisation was 105 per cent of prison design capacity in 2007-08. The figure for open prisons was 100 per cent and 107 per cent for secure facilities
– from Report on Government Services 2009, Productivity Commission: http://www.pc.gov.au/gsp/reports/rogs/2009

