
Considering the merits and legal aspects of cycle helmet legislation and fines or sentences in Victoria, Australia
Author Colin Clarke
In Victoria, the Magistrates’ Court, 393 charges of cyclists failing to wear an approved bike helmet were sentenced in the three years leading up to 30 June 2021. The most common sentence for a charge of this offence was a fine (46.1%, or 181 of 393 charges). In 9 cases a prison sentence was applied[1]. This study considers the evidence regarding requiring people riding bicycles to wear helmets on public highways and the basis of fines and legal action for not wearing one, with a focus on Australia and Victoria, the first State that introduced a cycle helmet law in 1990. Most of the enthusiasm for helmets amongst the road safety establishment and parts of the medical profession stemmed from research in the 1980’s that claimed big benefits from cyclists wearing helmets. Claims such as an 85% reduction in head injury and a 90% reduction in fatalities were cited, however, the claims have since been rigorously undermined by subsequent re-analysis. Until the 1990’s, most of the debate about cycle helmets related to issues of liberty, those believing they must provide a safety benefit and others who were pro-choice. Now more t
Considering the merits and legal aspects of cycle helmet legislation and fines or sentences in Victoria, Australia
Author Colin Clarke
In Victoria, the Magistrates’ Court, 393 charges of cyclists failing to wear an approved bike helmet were sentenced in the three years leading up to 30 June 2021. The most common sentence for a charge of this offence was a fine (46.1%, or 181 of 393 charges). In 9 cases a prison sentence was applied[1]. This study considers the evidence regarding requiring people riding bicycles to wear helmets on public highways and the basis of fines and legal action for not wearing one, with a focus on Australia and Victoria, the first State that introduced a cycle helmet law in 1990. Most of the enthusiasm for helmets amongst the road safety establishment and parts of the medical profession stemmed from research in the 1980’s that claimed big benefits from cyclists wearing helmets. Claims such as an 85% reduction in head injury and a 90% reduction in fatalities were cited, however, the claims have since been rigorously undermined by subsequent re-analysis. Until the 1990’s, most of the debate about cycle helmets related to issues of liberty, those believing they must provide a safety benefit and others who were pro-choice. Now more than 30 years later, the real world evidence can be considered.
A significant feature of the Australian Constitution, and one which is essential for good government, is that the judicial function is separated from the legislative and executive functions, and the judicial power is vested in independent judges with security of tenure. The Constitution provides for federal courts not only to interpret and apply the law in determining issues between governments and persons and between persons, but, by interpreting and applying the Constitution to such issues, thereby to determine the lawfulness of the actions of the legislative and executive branches of government. It is therefore doubly important that the judges have complete independence from the other two branches[2]. When cyclists are fined for not wearing helmets it is important that the justice system considers carefully the reasons provided in their defence and if a reasonable doubt exists about helmet benefit or the health consequences, they take this into account.
Background
In the early 1980s Australia had a road fatality rate of about 22 per 100,000 population and efforts to improve road safety were being made. By 1989 the rate was 16.5 per 100,000 population[3]. Schools were providing bike education courses to encourage safe riding behaviour[4]. Cycle helmet promotion and legislation was promoted. Transport Accident Commission (TAC) data from Victoria[5] for head injury claims by bicyclists involved in motor vehicle accidents detailed that most were aged less than 18 years of age in the period 1987-1989 – see Table 1 (added Melbourne cycling exposure 1987/88 data – refer Fig 9 Cameron 1992 and Fig 27, Finch 1993).
|
Age |
Head |
Concussion |
Hd + Conc |
Total claims |
Percent Hd+Conc |
Approximate exposure, billions of seconds per week |
|
0-11 |
48 |
27 |
75 |
514 |
14.6 |
5-6 |
|
12-17 |
82 |
45 |
127 |
1162 |
10.9 |
9-11 |
|
18+ |
40 |
22 |
62 |
812 |
7.6 |
5-6 |
|
total |
170 |
94 |
264 |
2488 |
10.6 |
20-24 |
Table 1 TAC head injury claimants 1987-89
Data from the 1980s for Australia was used to assess the rate of serious injury per 10 million km[6] cycled. It varied by age group as shown in Table 2. The ‘All’ rate was 39 for males and 21 for females. On average, one injury equated to approximately 285,000 km cycled, that is a low risk The percentage of travel is shown for comparison.
|
Age |
9-10 |
11-13 |
14-17 |
18-29 |
30-60 |
60-64 |
65 + |
All |
|
Rate |
107 |
45 |
32 |
16 |
22 |
12 |
110 |
35 |
|
% travel |
3.8 |
16 |
35.5 |
25.4 |
16.1 |
2.4 |
0.8 |
100 |
|
Rate x % travel |
4.07 |
7.20 |
11.36 |
4.06 |
3.54 |
0.29 |
0.86 |
31.38 |
|
totals |
22.63 |
8.75 |
31.38 |
|||||
Table 2 Approximate serious injury rate per 10 million km
The serious injury rate per 10 million km for those 18 and older was probably about 20% of the total, with data for the 1-8 age group not published.
Proportion of children’s injuries
VISS data from Victoria[7] provided information on the distribution of injuries for children younger than 15 years of age, as shown in Figure 1.

Figure 1
Helmet wearing rates
Vic Roads had conducted annual surveys of the wearing rates from 1983 to 1990[8]. For primary schoolchildren the rate had increased in each year but for secondary it had reduced in the Melbourne area in 1988 and 1989. For adults the highest wearing rates reported was 46% for commuters in Melbourne and the lowest for recreational in country areas at 10%[9].
Victoria cycle helmet legislation
In 1990 prior to the law being introduced 1st July, a cost assessment (Regulatory Impact Statement) of the law was provided. It assumed reduced head injury rates would be one effect, but no consideration or assessment was given to if cycling would reduce due to the helmet requirement and the potential health consequences. Surveys from 1990 and 1991 shows the major effect from the legislation with a drop of 36% in the numbers cycling in Melbourne[10] – see Figure 2. Post law in 1991, 10% extra wore helmets compared to 36% fewer people cycling. It is evident that it had discouraged cycling, which was in sharp contrast to seat belts which did not discourage driving. A before-law survey in Melbourne showed that 272 out of 1293 teenagers (12-17yrs) wore helmets. In 1991 after the law was enforced, 302 wore helmets out of 670, i.e. 30 extra wore helmets compared with 623 fewer cycling.
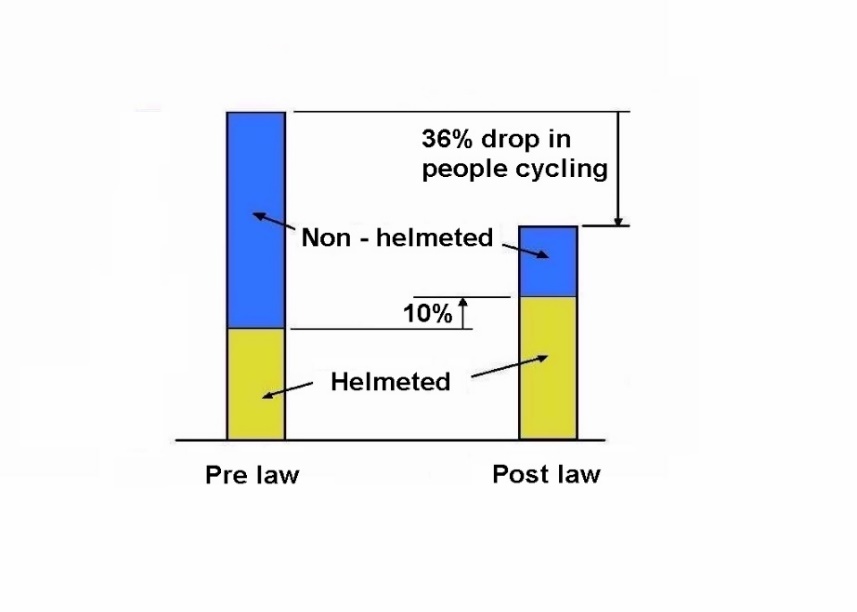
Figure 2 Changes pre to post law for Melbourne
Note: Figure 3 is based on data from Table 4, Robinson 1996[11] – 1110 fewer cyclists and 297 extra wearing helmets.
A major criticism of the law in 1991 was that it had reduced cycling levels and one article, ‘Riding numbers plummet‘[12] reported that it seemed people who did not want to wear them had ceased cycling altogether – refer Appendix A. With police enforcement there was a total of 19229 fines in the first 12 months for Victoria. A typical fine was $15 in 1991 compared with $240 in 2023[13]. To follow inflation the $15 should be approximately $35[14]. Professors Julia Quilter and Russell Hogg stated ‘the fines are way too high and begging to be abused by police. They can have long-term deleterious effects on children and families, especially the poor[15]’.
Census data for Australia indicates that helmet laws discouraged cycling over an extended period, as shown in Table 3, refer Figures 3 and 4. For Victoria in 2021 the rate was 0.7 and actual number dropped, from 33965 in 2016 to 22267 in 2021[16].
|
Year |
1986 |
1991 |
1996 |
2001 |
2006 |
2011 |
2016 |
2021 |
|
% cycling to work |
1.68 |
1.56 |
1.24 |
1.21 |
1.24 |
1.29 |
1.24 |
0.7 |
Census cycling data for Australia Table 3
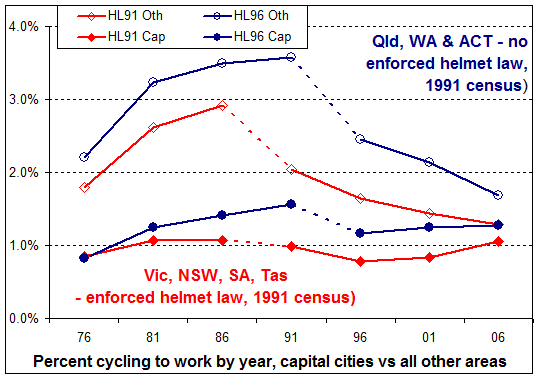
Figure 3[17]
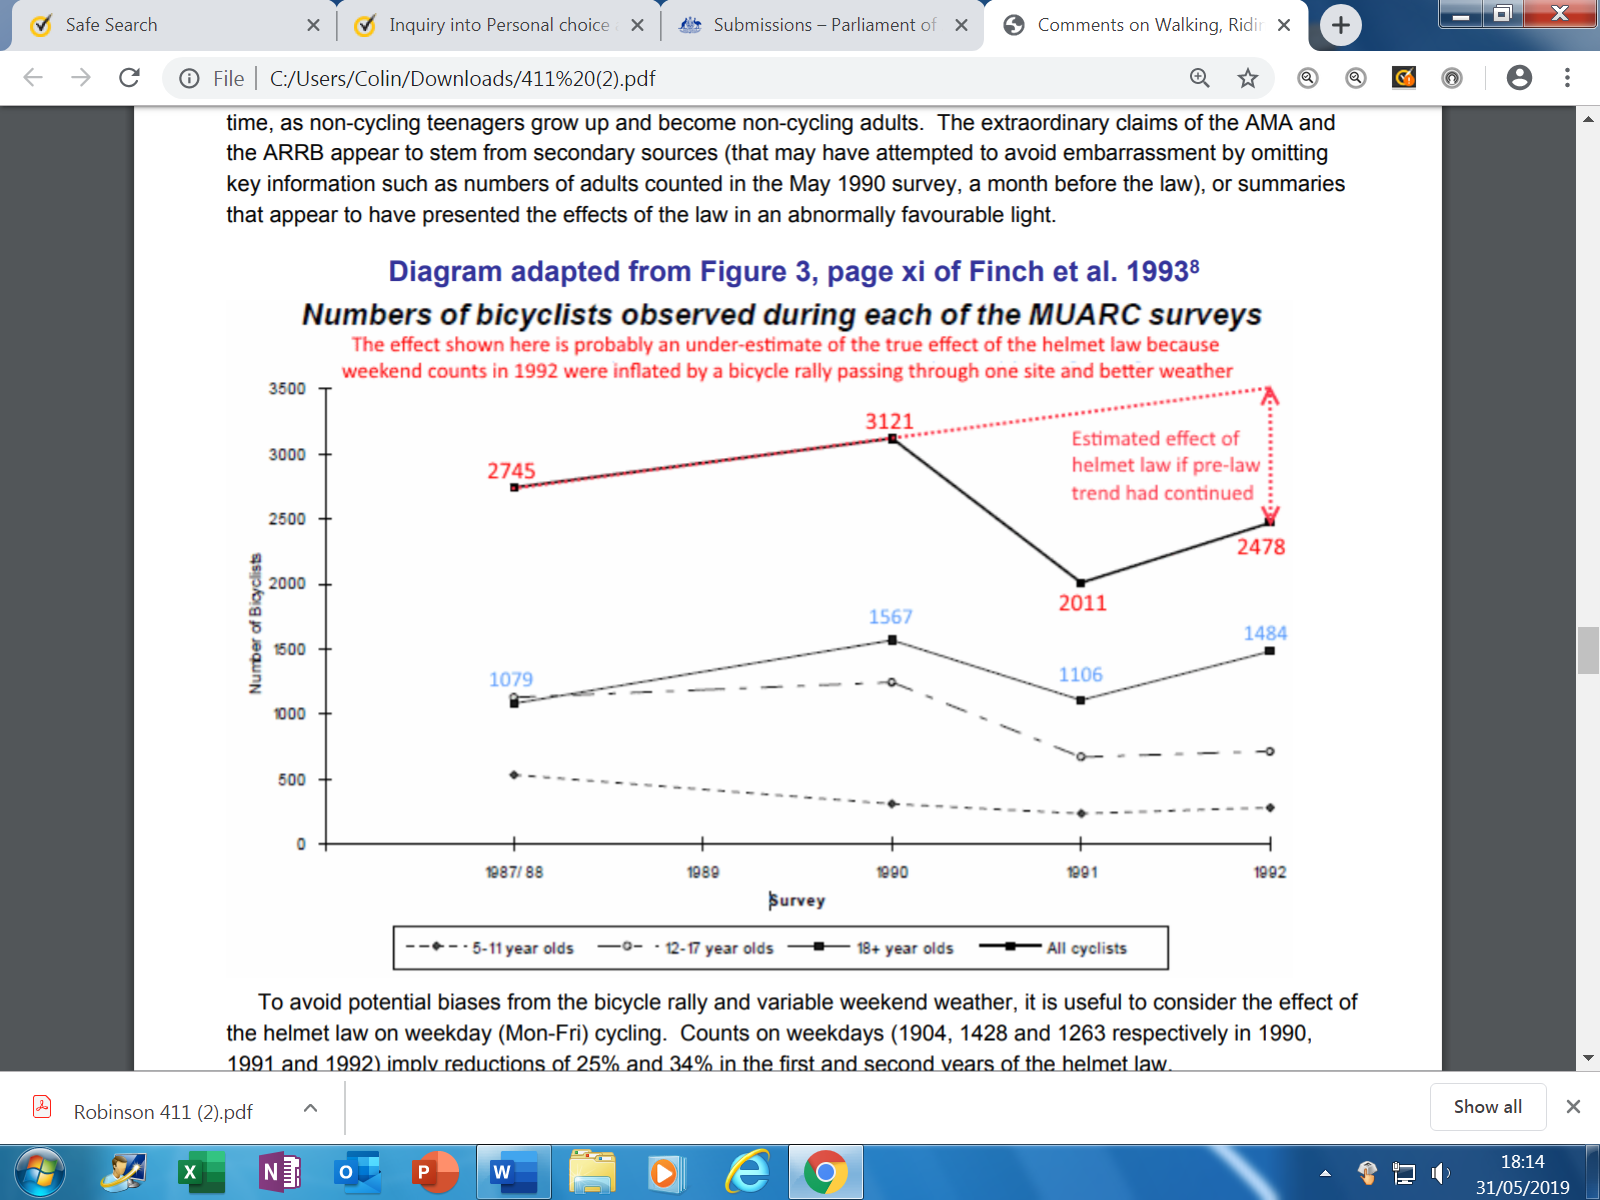
Figure 4 (From submission by Dorothy Robinson to WA Inquiry[18])
Petition to Victoria’s Parliament
On 28 May 1991 a petition[19] was presented to the Parliament, ‘Safety helmets for bicyclists’. It stated,
To the Honourable the Speaker and members of the Legislative Assembly in
Parliament assembled:
The humble petition of the undersigned citizens of Australia respectfully showeth:
That your petitioners are gravely concerned that the introduction of the
bicycle helmet wearing mandatory regulation has the effect of increasing the
risk of having an accident by the combined reasons of 1 to 7 as listed:
1. Increased fatigue due to the extra weight on the head.
2. Increase in head temperature.
3. Giving the rider a higher centre of gravity, making turning less stable.
4. Peripheral vision reduction in some cases.
5. Noise effects: many cyclists experience noise increase which reduces
their awareness of approaching traffic.
6. Reduction in the head’s ability to move quickly in observing traffic,
due to increased weight and chin strapping.
7. Having a feeling or sense of being safe, reducing caution and taking
increased risks.
The combined risks of 1 to 7 being reflected in the Victorian accident statistics for years 1984-8 as cyclists aged 17-50 years old had a 119 per cent increase in accidents.
Your petitioners most humbly pray that the Parliament will change the law to ensure that for bicyclists over eighteen years old there is no legal requirement to wear a helmet.
And your petitioners, as in duty bound, will ever pray.
By Mr Wallace (1005 signatures)
Laid on table.
Victoria’s Parliament made on response to the petition, it was not disputed.
Increased accident rate with helmet use
Reportedly 48.8%[20] of adult commuters in Melbourne were wearing helmets in 1989 and for Victoria, cycling increased by 47% between 1986 and 1989[21]. Census data for Victoria shows similar cycling levels for 1981 and 1986, 1.79% v 1.75%. The 119% increase in the accident rate for adults in the 17-50 age range between 1984-88 is therefore a serious concern at a time of increased helmet wearing. The increase in accidents being much higher than the increase in cycling levels.
Cameron et al 1994[22] provided details of TAC data (from motor vehicle/cyclist accidents) with the percentage reduction in severe bicyclist casualties relative to the 1989/90 financial year. For Melbourne, (Table 4, in report, copied below) bicyclists without head injuries fell by 4% and 12% for the years 1990/91 and 1991/92. Cycling was generally reduced by 35.6% compared to the reported 4% and 12% reductions, meaning the accident rate increased by approximately 36.6% relative to cycling levels, i.e. (1-0.12=088)/(1-0.356=0.64) = 1.366

In 2013 Vic Roads reported ‘Two years after the legislation was introduced, there was a 16% reduction in head injuries in metropolitan Melbourne and a 23% reduction in head injuries throughout Victoria’. It should be noted the overall road toll from 1989 to 1992 for Victoria reduced from 777 to 396, so safer road behaviour occurred, reportedly due to reduced speeding and lower levels of drink driving. Lower impact speeds can result in significantly lower head injury severity for bicyclists according to research by Janssen and Wisemans 1985[23]. From 1990 to 1992 TAC data also shows a reduction in the head injury rate for pedestrians. Teenagers with the highest serious injury ‘rate/travel figure of 11.36 (Table 2), and the largest group for TAC claims (Table1), were significantly discouraged from cycling by the law, 45% to 48% reported. TAC accident data 1987-89 from Victoria, Table 1, shows the younger aged groups to have a higher proportion of head / concussion injuries. The 12-17 age group had the highest TAC number of claims, and they had the largest reductions in cycling, so it would be expected for head injuries to reduce.
Robinson’s 1996 reported[24] injury data for children from Victoria and New South Wales. In Victoria, the equivalent injury numbers for pre-law levels of cyclist numbers increased from 809 to 944, a 16% increase from 1990 to 1992 (see Table 5 in study). Robinson’s data in Table 2 for children in NSW shows the equivalent number of injuries increased from 1,310 (384 head + 926 other injuries) pre law in 1991 to 2,083 (488 head + 1,595 other injuries) in 1993. The relative injury rate proportional to cycling levels increased 59% from 1,310 to 2,083. The relative increase for ‘other’ injuries was 72% and for ‘head’ was 27%, refer. Robinson refers to the Wasserman data that detailed the incidence of cyclists hitting their head/helmet during an 18-month period was “significantly higher for helmet wearers (8/40 vs 13/476 – i.e. 20% vs 2.7%, p 0.00001).” A bare head width of approximately 150mm may avoid contact compared to a helmeted head at approximately 200mm wide (Clarke 2007[25]). Assuming the 20% and 2.7% figures are typical, on a yearly average for helmeted and non-helmeted the risk of hitting their helmet or head would be 13.2% and 1.8% respectively. The increased risk of impact for helmets is about seven times higher. A degree of protection could be expected plus a degree of risk from the extra impacts.
Erke and Elvik 2007[26] examined research from Australia and New Zealand and stated that “There is evidence of increased accident risk per cycling-km for cyclists wearing a helmet. In Australia and New Zealand, the increase is estimated to be around 14 per cent.”
Clarke and Gillham 2019[27] reported, ‘Published studies and research within this paper from jurisdictions with all-age, child and/or adult mandatory helmet jurisdictions consistently suggest reductions in cycling participation when laws are enforced but either no corresponding decrease in hospitalised total injuries or an increase in all-body injuries. Further, there is strong evidence that helmeted cyclists suffer a higher rate of upper body limb injuries than non-wearers, suggesting a higher rate of falls than non-wearers. Bicycle helmet wearing globally has increased over the past 30 years via promotion and in some cases legislation. Various reports have assessed the changes in wearing rates, accidents, injuries and cycling activity levels. A limited number of reports have analysed overall changes in accident risk per kilometres cycled, per hours cycled or in relationship to cycling levels via survey information. A significant number of findings suggest a higher accident/injury rate may result from helmet usage. Accident data from Australia, the United States, Canada, the United Kingdom and New Zealand indicate the accident rate per hour cycled or per miles cycled has increased with greater helmet usage, most likely from a greater proportion and number of upper limb injuries. Consideration is given to why the accident rate may change and if overall safety is improved or reduced by helmet usage’.
Support for helmet legislation
Vic Roads quotes evidence in support of legislation[28], stating.
Research
Research indicates that bike helmets greatly reduce the risk of head injuries, which are the major cause of death and injury to bike riders. A comprehensive systematic review of 40 studies was published in the prestigious International Journal of Epidemiology in 2016 and found that bicycle helmets reduce the chances of a serious head injury by almost 70 %.
Examining Vic Road’s evidence
The 40 studies are ‘case-control studies’ that do not estimate risk per hour or km cycled, they are based on comparing injuries for helmeted v non-helmeted. From the 40 studies, 30 related to serious head injuries. Two of the 30 studies reported that non-wearers were involved in more severe impacts, Spaite 1991 (USA) and Bambach et al 2013 (NSW).
Spaite 1991[29] stated, ‘However, a striking finding was noted when the group of patients without major head injuries was analysed separately. Helmet users in this group had much less serious injuries than non-users. The researchers concluded that helmet non-use is strongly associated with serious injuries even if those without serious head injuries are excluded. This implies that non-users of helmets tend to be in higher impact crashes than helmet users, since the injuries suffered in body areas other than the head also tend to be much more severe. It is possible that at least some of the ‘protection’ afforded helmet wearers in previous studies may be explained by safer riding habits rather than solely a direct effect of the helmets themselves’.
Bambach et al[30] reported; ‘Non-helmeted cyclists were more likely to display risky riding behaviour, however, were less likely to cycle in risky areas; the net result of which was that they were more likely to be involved in more severe crashes’. Bambach et al reported some of the differences between helmet wearers and non-wearers for cycle accidents with motor vehicles involved, as shown in Table 5. e.g. 55% of those not wearing a helmet were in the age 0-19 yrs. Disobeying traffic control and having a BAC over 0.5 comprised 16.6% for the no-helmet group compared with 5% for helmeted. Bambach et al did not provide details of wearing hi-visibility attire or on the use of lights.
|
No helmet |
Helmet |
|
|
Age 0-19 |
55% |
18.5% |
|
Disobeying traffic control |
9.4% |
3.3% |
|
BAC over 0.5 |
7.2% |
1.7% |
|
Riding on footpath |
34.4% |
12.9% |
|
Serious injury other than head |
9.5% |
7.3% |
|
Not in daytime |
27.9% |
23.3% |
Table 5
BAC – blood alcohol content
From the 30 serious head injury studies, 6 provided adults only data, Dinh 2010 et al, Dinh 2013 et al, Dinh et al 2015, Crocker et al 2012, Wagner et al 2012 and Zibung et al 2014. Wagner et al (USA) data showed an increased risk of serious head injury. From the 5 helmet favourable reports, 3 from Sydney Australia, 2 from USA and 1 from Sweden. Dinh et al reported a higher rate of falls for helmeted, and for non-helmeted a higher proportion that had been drinking, detailing in one study that 2% of helmeted had been drinking v 20% for non-wearers. Crocker et al detailing 1.5% v 33.4% (alcohol and drug use) and Zibung et al 7.9% v 32% (alcohol) had similar findings for drinking alcohol with non-wearers at much higher levels. Crocker stated.
Alcohol use and head or brain injury continued to demonstrate positive correlation in both the helmet-wearing and non-helmet-wearing groups independently (p < 0.05 and p < 0.005, respectively), indicating that alcohol use is linked to increased likelihood of a head or brain injury whether or not the rider is wearing a helmet.
Bicycle alone accidents result in a higher proportion of arm fractures than bicycle/motor vehicle accidents.[31] With a higher fall off rate comes a lower rate of serious head injury. Dinh et al reported 62% of helmeted having upper limb injuries v 41% for non-wearers[32]. Similar data was reported from Queensland that Clarke 2015[33] refers to, ‘Monograph 5 Table 14 shows helmet wearers to have a ‘Shoulder/Upper limb’ rate of 28.3% and non-wearers a rate of 18.4%.’Therefore helmet wearers may have had a larger proportion of injuries due to bicycle alone type accidents or falls. Cyclist head injuries due to falls have been reported to have about half the average length of hospital stay compared with cyclists involved in collisions with motor vehicles[34]. This provides another reason why a lower proportion of serious head injuries is sometimes reported for helmeted cyclists.
USA data shows helmet wearers are much more likely to use lights at night[35]. Because of the differences in behaviour and alcohol use the 5 studies do not constitute sound evidence that helmet use provides an overall safety benefit. Clarke 2017[36] examined the meta-analysis and the 40 studies and concluded, ‘A meta-analysis by Olivier and Creighton includes reports that compare the proportion of head injuries or other injuries for wearer vs non-wearers. Weaknesses in this approach stem from the combined effect of issues which affect both the accident rate and head injury rate for helmeted vs non-helmeted or not fully being able to evaluate the differences that occur. The meta-analysis claims that helmet use is associated with odds reductions of 51% for head injury, 69% for serious head injury, 33% for face injury and 65% for fatal head injury. When examined in detail, all were found to be unreliable claims due to weaknesses of the supporting evidence and methodology’.
The USA 1989 Seattle study[37] ‘A case-control study of the effectiveness of bicycle safety helmets’. Cyclehelmets.org reports, support by government agencies for the study was withdrawn[38]. This study claimed helmets reduce head injuries by 85% and gave weight to introducing legislation. Further Postscript – support for study withdrawn by Government agencies
In June 2013, US federal agencies The National Highway Traffic Safety Administration (NHTSA) and the Centers for Disease Control (CDC) decided that they could no longer justify citing the claim by this research that bicycle helmets reduce the risk of head injury by 85%. The agencies had been challenged under the Data Quality Act to show why they ignored later research, none of which had produced such convincing results. (GGW, 2013)
Recent studies have cast doubt on the reliability of published case control studies and meta-analyses regarding the effectiveness of bicycle helmets. Zeegers 2015[39] states that “Three cases could be found in the literature with sufficient data to assess both risk ratios and odds ratios: the Netherlands, Victoria (Australia) and Seattle (U.S.A). In all three cases, the problem of overestimation of the effectiveness of the helmet by using odds ratios did occur. The effect ranges from small (+ 8 %) to extremely large (> + 400 %). Contrary to the original claim of these studies, in two out of three cases the risk of getting a head injury proved not to be lower for helmeted cyclists. Moreover, in all three cases the risk of getting a non-head injury proved to be higher for cyclists with a helmet.”
Zeegers estimated the 1989 study overestimated the effectiveness of helmets by 400%. Nearly all the 40 studies used the same approach as the Seattle study, so most of them may have overestimate the effectiveness of helmets. The case control studies do not match the real world bigger picture of population results, for example in 2015 Teschke et al reported, ‘Helmet legislation was not associated with reduced hospitalisation rates for brain, head, scalp, skull or face injuries, indicating that factors other than helmet laws have more influence on injury rates’. [40]
Baschera et al 2021 study from Western Australia of 15yo+ cyclists, 2008-2015, who were admitted to the Royal Perth Hospital trauma unit found 88% of TBIs were mild among both helmet wearers and non-wearers, 3% were moderate among helmet wearers vs 10% among non-wearers, and 9% were severe among helmet wearers vs 2% among non-wearers. Among the 461 helmet wearers, 10 suffered severe TBI (2.16%). Among the 144 non-wearers, one suffered severe TBI (0.69%). The Baschera et al study shows 32.6% of non-helmet patients were affected by alcohol compared to 3.2% among helmeted cyclists, confirming other research showing significantly higher alcohol influence among injured non-helmet cyclists.
Curnow[41] provided a scientific evaluation of bicycle helmets and recognised the importance of minimising rotational acceleration. StClair and Chinn (2007)[42] reported ‘However, in both low speed linear impacts and the most severe oblique cases, linear and rotational accelerations may increase to levels corresponding to injury severities as high as AIS 2 or 3, at which a marginal increase (up to 1 AIS interval) in injury outcome may be expected for a helmeted head.’ This indicates that helmets may contribute to a worse outcome from falls at low speeds, common when a fall is due to a foot slipping off the pedals for example.
Different behaviour reported between helmeted and non-helmeted cyclists.
Table 6 below shows there are often major difference in behaviour between helmet wearers and non-wearers that would often increase the accident risk for non-wearers, supporting the findings of Spaite 1991 and Bambach et al 2913 that reported more severe impacts. Cyclists with helmets were more likely to use other safety measures, avoid alcohol use and use lights. Those without helmets were more likely to be at higher risks of severe accident and head injury due to several factors.
|
Reported differences |
Helmeted |
No helmet |
Reference |
Risk factor |
|
Riding against flow of traffic |
2.8% |
12.3% |
Webman et al 2013[43] |
3.6 to 6.6[44] |
|
Crossing against signals |
5.5% |
12.3% |
Webman et al 2013 |
n.a. |
|
Alcohol use |
0% |
31% |
Airaksinen et al 2010[45] |
n.a. |
|
Alcohol or drug use |
1.5% |
33.4% |
Crocker et al 2012[46] |
n.a. |
|
Alcohol use |
6.3% |
11.1% |
Webman et al 2013 |
n.a. |
|
Alcohol use |
7.9% |
32% |
Zibung et al 2014 |
n.a. |
|
Alcohol use |
4.7% |
22.2% |
Harada et al 2015[47] |
n.a. |
|
Alcohol use |
6.2% |
20.2% |
Sethi 2015[48] |
n.a. |
|
Alcohol use |
2.0% |
20% |
Dinh et al 2015[49] |
n.a. |
|
Alcohol use – Canada fatality data |
4.0% |
33% |
Gaudet et al 2015[50] |
n.a. |
|
Alcohol use – UK data |
7.4% |
18.6% |
Forbes 2017[51] |
.n.a. |
|
Alcohol use, average 9 above |
4.4% |
24.6% |
Ratio 1:5.6 |
Up to 20[52] |
|
Time of accident 8:01pm to 5:00am |
7.9% |
37.1% |
Crocker et al 2012 |
2-5 range for NL[53] |
|
Time of accident 9:00pm to 5:59am |
14.4% |
23.6% |
Sethi et al 2015[54] |
2-5 range for NL |
|
Use of electronic devices |
7.9% |
13.7% |
Sethi et al 2015 |
n.a. |
|
Skill level – beginner |
3.2% |
12.5% |
Crocker et al 2012 |
n.a. |
|
Wearing high visibility clothing -UK |
27.9% |
3.5% |
McGuire et al 2000[55] |
n.a. |
|
Using front and rear lights -UK data |
52.9% |
37.5% |
McGuire et al 2000 |
n.a. |
Table 6
Examples from helmet laws, when enforced, reducing cycling.
Details below show evidence of reduced cycling from the helmet laws. Comparing adult pedestrian to cyclist deaths, show a reduction in safety, compared with cycling levels.
1)
Melbourne surveys, pre to post helmet law, showed 30 more teenagers wearing helmets compared with 623 fewer cycling, a drop of 48%, with 20 fewer cycling for each extra one wearing a helmet[56].
2)
Morgan et al provided details of adult commuters counted in 1990 and 1991 – 5162 and 3226, a drop of 37%. They also detailed numbers counted at recreational sites – 2494 in 1990 and 1479 in 1991, a drop of 41%[57].
3)
For children in New South Wales after their helmet law, 569 extra wearing helmets compared with 2658 fewer counted[58]. Adults at rural road sites had a reduction of 37.6% from 1990 to 1993. Wet weather in the first survey affecting coastal cycling level. For adults counted at road sites a 25.9% reduction occurred from 1991 to 1993, from 5734 down to 4251.
4)
Adelaide surveys from 1986 to 1999 shows the numbers of trips by bicycle per day reducing from 890,000 to 400,000’[59], representing a reduction of 55%. Brisbane, Perth and Adelaide census counts for cycling to work in 1991 and 1996 shows a drop from 20054 to 14903, representing an approximate 30% drop when population growth is included.
5)
Perth cycle-way counts also show reduced cycling. Automatic counters installed on two key cyclist bridges in Perth over the Swan River recorded an average of 16,326 cycle movements weekly for the three months October to December 1991 (pre-law). The same months in the post law years 1992-94 recorded 13067, 12470 and 10701 cyclist movements per week, reductions of 20%, 24% and 34% in years 1 to 3 of the law[60].
6)
Census data shows reduced cycling levels for Australia as shown below[61] in table 7 comparing cyclists to pedestrians, (17 years and older). Prior to helmet legislation cyclist deaths were approximately 10% compared with pedestrians, in 2021 they were 33.6%.
Table 7 Australia – fatalities (17 years and older[62])
|
1981 |
1986 |
1991 |
1996 |
2001 |
2006 |
2011 |
2016 |
2021 |
|
|
Cyclists – C |
33 |
39 |
35 |
37 |
34 |
39 |
32 |
29 |
39 |
|
Pedestrians. – P |
491 |
423 |
292 |
306 |
253 |
197 |
172 |
170 |
116 |
|
C/P% |
6.7 |
9.2 |
11.9 |
10.2 |
13.4 |
16.2 |
18.6 |
17.0 |
33.6% |
|
% cycling to work |
1.56* |
1.68* |
1.50* |
1.24* |
1.21* |
1.24* |
1.29* |
1.24* |
0.7*** |
|
% walking to work |
4.4** |
3.9** |
3.9** |
3.5** |
3.5** |
4.0** |
3.9* |
4.2* |
2.5*** |
* national data
** data from main cities
*** https://www.abs.gov.au/articles/australias-journey-work
7)
Evidence of continued discouragement includes the fact that helmets were cited as the main barrier to using the Melbourne Bike Scheme[63].
Australia serious injury data,
(refer Clarke and Gillham 2019 study, Table 2 )
Table 8
|
1990 |
2003/04 |
2005/06 |
2008/09 |
2012/13 |
2021/22 |
|
|
Cyclists |
7520 |
7929 |
8814 |
9577 |
10098 |
14796* |
|
Pedestrians |
5048 |
3715 |
3779 |
3686 |
3823 |
3510 |
|
C/P (actual) |
1.49 |
2.13 |
2.33 |
2.60 |
2.64 |
4.21 |
|
Cycling level % proportional |
100 |
60 |
59 |
58 |
N/A |
N/A |
|
Equivalent C/P – estimate |
1.49 |
3.55 |
3.95 |
4.47 |
N/A |
N/A |
* https://www.aihw.gov.au/reports/injury/transport-accidents#typestransports
Senate Hearing
The Senate hearings on the cycle helmet topic[64] interviewed many people and had many submissions. Extra comment from the Chair stated[65], ‘During the course of the hearing, and based on available data, it became clear MHL have undermined cycling participation rates. Attempts to argue to the contrary, especially given evidence from around the world, were not at all persuasive’. Data for New Zealand, where they published estimated hours cycled shows a reduction in average hours cycled per person of between 41.24% and 59.32% and an increased accident/injury risk based on per million hours cycled of between 34.96% and 121.31%[66]. Australian evidence shows the helmet laws had both short- and long-term effects in reducing cycling levels.
Post Concussion report
Moore et al (2020) reported on 28 adult cyclist post-concussion syndrome (PCS) cases (20 helmeted v 8 non-helmeted) that “The mean duration of PCS for helmet wearers was 22.9 months, and 16.8 months for patients not wearing a helmet at the time of concussion (p=0.41)”, and ‘We found that patients with one or more previous concussions had a greater duration of symptoms compared with those with no previous concussions (p=0.042). This is consistent with our previous study showing those with previous concussions have a longer recovery period. Covassin et al also found that athletes with previous concussions took longer to recover compared with those without a concussion history’. From 28 cases, 8 had no previous concussions, with 20 cases having more than one concussion. At least 12 helmeted had more than one concussion
Genda considerations
A USA study, Feler 2020[67] compared the outcome from helmet wearing for male v female and stated,
Results In total, 18 604 patients of average age 48.1 were identified, and 18% were female. Helmet use was greater in females than males (48.0% vs 34.2%, p<0.001). Compared with helmeted males, helmeted females had greater rates of serious head injury (37.7% vs 29.9%, p<0.001) despite less injury overall. In sex-disaggregated models, helmet use reduced odds of intracranial haemorrhage and death in males (p<0.001) but not females. In sex-combined models, helmets conferred to females significantly less odds reduction for severe head injury (p=0.002), intracranial bleeding (p<0.001), skull fractures (p=0.001), cranial surgery (p=0.006) and death (p=0.017). There was no difference for cervical spine fracture.
The study details high levels of alcohol use by male non-helmeted cyclists, 27.4% compared to 4.6% for helmeted, and it is likely this affected the outcomes, making comparing helmeted to non-helmeted unreliable. The overall result from helmet use for females was negative. Australian data shows they had a lower risk than males and adding helmets appears to increase their risk levels. In boxing they require female to wear helmets but not males[68], mainly because of insufficient data on females.
Health benefits of cycling
The health benefits of cycling far outweigh the risks involved, reportedly by between 13 to 1 and 415 to 1[69]. The health benefits involve the immune system, muscles, the skeleton system, spinal diseases and back pain, joint protection, balance and equilibrium, mental stress, oxygen and circulation, heart and cardiovascular diseases, body weight, adiposity and obesity, body fat and hypercholesterol, blood pressure, cancer, stamina, beauty and attractiveness, physical workout, quality of life, and additionally if people cycle and not drive environmental benefits[70].
Australia 2018, overweight (including obesity) was responsible for:
55% of type 2 diabetes disease burden.
51% of hypertensive heart disease.
49% of uterine cancer.
43% of gout.
42% of chronic kidney disease.
Overweight (including obesity) contributed to around 16,400 deaths (10% of all deaths) (AIHW 2019).(compared with reported, 35[71] – 42 cyclist deaths[72])
The total disease burden attributable to overweight (including obesity) in 2018 was 2.2 times greater in the lowest socioeconomic group compared with the highest socioeconomic group (AIHW 2019)[73]. Clarke 2015 provided an evaluation of Australia’s bicycle helmet law and reported the disadvantages in health terms outweighed the potential benefits by 109 to 1[74]. Cycling UK[75] stated: However Cycling UK is not only concerned about the harmful effects of mandatory helmet use. By creating exaggerated perceptions of the risks of cycling, even voluntary helmet promotion campaigns have been found to deter some people from cycling. Given that the health benefits of cycling outweigh the risks by around 20:1 (one recent study put it at 77:1), it can be shown that only a very small reduction in cycle use is needed for helmet promotion (let alone helmet laws) to shorten more lives than helmets themselves could possibly save, regardless of how effective helmets might be.
Research from Australia has claimed, ‘a 10% reduction in physical inactivity would result in 6,000 fewer incident cases of disease, 2,000 fewer deaths’[76].
Fines and sentences
Legislation started in Victoria on 1 July 1990 with penalty fines of $15 for not wearing cycle helmets. Exemptions from the legal requirement are sometimes allowed on medical or religious grounds. In the first 12 month 19,229 fines were issued in Victoria, 20314 in 1997, 15,950 in 1999, and about 20,000 in 2003. In the three years leading up to 30 June 2021, the Magistrates’ Court, had 393 charges of cyclists failing to wear an approved bike helmet were sentenced. The most common sentence for a charge of this offence was a fine, court cases can impose higher fines. (46.1%, or 181 of 393 charges). In 9 cases a prison sentence was applied[77]. In 2023 the penalty fines for not wearing a helmet are $240, much higher than NT or WA[78]. To keep pace with inflation the $15 fine level should be about $35 in 2023.
For New South Wales concerns have been expressed about the high levels of fines,[79]Julia Quilter, Associate Professor of Law, University of Wollongong and Russell Hogg, Adjunct Professor, School of Justice, Queensland University of Technology ‘Cycling is often held up as a model of healthy and sustainable urban transport. So why have bike laws become more, not less, draconian? Our ongoing research shows mandatory helmet laws have become a tool of disproportionate penalties and aggressive policing’. And ‘The penalty for riding without a helmet is now ludicrously excessive. Proportionality between penalty and offence has been lost. The goal is meant to be harm reduction. Piling on the fines does more harm than good’.![]()
Legal aspects
The right to health is part of the Australian Constitution[80]. It has been recognised that cycling has a significant impact on fitness and mental health[81].
The overall function of government is to act in the best interest of the population and to provide safeguards to ensure legislation is appropriate. The Victoria Parliament introduced cycle helmet law without assessing the societal health effects from reducing cycling. Cyclist accident data for Victoria showed a significant increase for adults aged between 17 and 50 as helmet use increased and the Government failed to take full account of this. Government guidance on health states[82],
The right to health is the right to the enjoyment of the highest attainable standard of physical and mental health.
The right to health comes under Article 12(1) of the International Covenant on Economic, Social and Cultural Rights (ICESCR).
With the reported health benefits of cycling far outweighing the risks involved, reportedly by between 13 to 1 and 415 to 1[83] and with cycle helmet legislation discouraging a proportion of people from cycling, estimated at 30% or more[84], and with the risk of a higher accident rate associated with helmet wearing, the legislation fails to be in keeping with the right to health.
Many people cycle for exercise, enjoyment, fun, commute, shopping, educational and making it has hassle free and enjoyable as possible is very important. With helmet law and enforcement comes police involvement and social pressure to conform with the law. The wearing rate in Victoria prior to legislation was estimated at 35.9%, meaning approximately 64% of the population preferred to cycle without wearing a helmet. About 40% of hours cycled were in regional areas with lower wearing rates.
Having to wear a helmet makes cycling less convenient, especially for short rides. With police involvement, those preferring to cycle without one, are subject to the risk of being stopped and fined or appear in court. Children are under pressure to wear them, or their parents may be fined. Some parents may prefer to avoid the risk of being fined and not encourage their children to cycle. Some schools may also add pressure to children to conform. The situation detracting from the enjoyment for those wishing to cycle without wearing a helmet. Thus, impacting on their right to health i.e. ‘The right to health is the right to the enjoyment of the highest attainable standard of physical and mental health’.
The actual risk level from cycling varies from minor to fatal. Reportedly about 30% of Australian may cycle and this equates to about 8 million people and there are about 40 deaths annually, this roughly equates to about 1 in 200,000. If cycling for 50 years in a lifetime, 1 in 4000 lifetimes. Table 7 above shows the risk to cyclists compared with pedestrians over a 40 year period, including the period of helmet promotion and legislation, with a result of a 500% increase in risk compared to pedestrians, 33.6/6.7 = 5.01. The risk of serious injury for cyclists has also increased, refer Table 8, 7520 to 14796, C/P value increased from 1.49 to 4.21.
A NSW judge, after hearing evidence about cyclist Sue Abbott, agreed that the helmet law was unnecessary,[85] stating; “I frankly don’t think there is anything advantageous and there may well be a disadvantage in situations to have a helmet – and it seems to me that it’s one of those areas where it ought to be a matter of choice.” An issue arose concerning costs that resulted in goods being confiscated from Mrs Abbott’s home[86].
Discussion
In 1990 the Minister for Transport for Victoria stated, ‘Bicycling has an important role in transport, and is to be encouraged as the most energy efficient travel mode producing minimal effects on the environment, and as a mode which has positive effects on personal health and recreation’. The Parliament of Victoria introduced cycle helmet legislation in 1990 requiring helmets be worn with low level fines ($15) for those not complying and allowing for exemptions in suitable circumstances. This followed from 10 years of helmet promotion. Parliament was responsible for monitoring any consequences. There were annual surveys by Vic Roads from 1983 to 1991 but they did not continue, and Parliament should have ensured a full assessment for several years. In 1991 surveys showed the helmet law had discouraged cycling, the opposite to encouraging it. The Vic Roads surveys may have been stopped to help limit the evidence of reduced cycling stemming from the helmet law. For Australia Clarke claimed, ‘For the 0-16 age group, by 2001 cycling levels seem to have halved and by 2011 were down even further, with an approximate 80% reduction’. Data from New Zealand with an almost identical law and data on hours cycled shows a reduction for the age group 5-17 years from 1989/90 to 2011/14 of 81.7%. For Melbourne, cyclists aged 5-18 reportedly cycled 17.8 billion seconds per week pre law in 1990[87] and this dropped by 36% to 11.3 billion seconds by 1992. Estimating the population size for the 5-18 age group in 1990 to be about 600,000, this would equate to approximately 30,000 / 34,000 seconds per week for each person, or about eight hours per week on average. Garrard reported that Melbourne children aged 10-14 in the 1994-99 period averaged 26km per year[88] and this translated to about 400 seconds per week[89] or 7 minutes. In Victoria, the number of children cycling to school halved between 1985 and 2001[90].
Prior to the law being introduced, probably less than 36% (Victoria) where wearing helmets of their own accord and more than 64% not wearing (In the Melbourne area, approximately 41% wearing and 59% not). Melbourne surveys in 1991 shows a 36% drop in the number cycling, i.e. more than half of the non-wearing rate of 59% (Fig 2). The major effect of the law was therefore to discourage cycling. Regional areas had lower wearing rates and a proper assessment of the discouraging effects was not provided, however accident data suggests a larger percentage reduction in rural areas. Vic Roads surveys for 1991 reported by Morgan et al shows a drop for adult commuters from 5162 to 3226, a 37.6% reduction and also a drop for children from 994 to 484, a 51.4% reduction[91]. Prior to helmet legislation from 1986-1989, the proportion of people cycling in general was increasing by 10% -12% per year[92].
The 1991 helmet petition to Parliament expressed concerns about helmet use increasing the overall accident rate, that Parliament failed to act on. Research from Victoria and around the world has shown helmet use leads to a higher accident rate per million hours cycled, connected with a higher fall off rate. The reasoning for the legal requirement was based on the belief that helmets would provide a positive safety outcome, with no regard to any negative health consequences due to discouraging cycling. They expected income from about 3000 fines per year. In the first 12 month 19,229 fines were issued, 20314 in 1997, 15,950 in 1999, and about 20,000 in 2003. Each year there has been a high level of police involvement, contributing to discouraging cycling.
The evidence for the belief in helmets was largely based on comparison studies, motorcyclists v cyclists, from comparing cyclists wearing helmets to those not wearing or from comparing head injury rates as helmet use increased. In 1982 McDermott and Klug examined data for the period 1975 to 1980 and reported skull fractures for pedal cyclists exceeded those of motorcyclists in Victoria, however, the 181 pedal cyclist fatalities compared to 497 for motorcyclists/pillion passengers [93]. Per hour of travel motorcyclists had about 16 times the fatality risk of cyclists[94]. The number of hours cycling in Victoria was several times higher than the number of hours motorcycling, so that the comparison had a limited basis for promoting helmets. Following the McDermott and Klug report the Australian Medical Association (AMA) in 1983 adopted the policy of compulsory helmet wearing for pedal cyclists. Comparing cyclists wearing helmets to those not also has major problems, (see Table 6), as there are major differences in behaviour and again provides little sound evidence. The Seattle study claiming helmets reduce head injuries by 85% was published in 1989. In 2015 it was reported the study overestimated their value by 400%. Comparing head injury rates as helmet use increased in the early 1980’s also has issues because TAC data shows higher rates of head injury for younger cyclists and bicycle safety education was on going from about 1983, encouraging safer riding practices and cycling levels for children may have changed because the number of registered motor vehicles increased by 24% between 1980 and 1985, possibly contributing to less hours cycled by children.
From 1989 to 1992 overall road deaths in Victoria reduced from 777 to 396, a 49% reduction. In 1989 35,750 persons were injured. In the 12 months to the end of May 1993 22,216 persons were injured – 38% decrease. In 1989, 22.8% of vehicles were found to be exceeding the threshold limit. The proportion of speeding drivers fell markedly to 3.8% in June 1993. TAC data shows reduced head injuries for pedestrians of 23% from 1989 to 1992. For cyclists head injuries reduced by 33%[95]. Indications are that cycling levels reduced by more than 30%, with the highest head injury group, teenagers reducing by 45% to 48%. In 2013 Vic Roads reported ‘Two years after the legislation was introduced, there was a 16% reduction in head injuries in metropolitan Melbourne and a 23% reduction in head injuries throughout Victoria’. The reduction in head injuries to cyclists appear to be mainly due to reductions in cycling levels, especially for teenagers and improvements in road safety via less speeding and fewer cases of drink driving. A letter [96]to the Medical Journal of Australia shows the major reductions in road casualties for Victoria from 1990 to 1992 that would have contributed to reduced head injuries for cyclists. Monash University published several studies claiming higher reductions in head injuries, however the classification for head injury and hospital admission criteria may have changed.
Key points
1) Evidence prior to 1990 in support of helmet use was weaker than it first appeared.
2) Cyclist accident data for Victoria 1984/88 showed a significant increase (119%) for adults aged between 17 and 50 as helmet use increased and the Government failed to take full account of this.
3) The risk of a cycling fatality for the average person is estimated to be low, approximately 1 in 4000 lifetimes (0.025%) and for a serious head injury about 1%.
4) Research has reported that the health benefits of cycling far outweigh the risks involved, reportedly by between 13 to 1 and 415 to 1[97].
5) The Victoria Government failed to ensure statewide comparable surveys to be able to accurately assess cycling levels. Available evidence suggests children’s cycling reduced substantially. Research suggests the helmet law discouraged cycling by more than 30%. Potentially about half of non-wearers cycled less. Melbourne surveys, pre to post helmet law, showed 30 more teenagers wearing helmets compared with 623 fewer cycling, a drop of 48%, with 20 fewer cycling for each extra one wearing a helmet[98]. Despite a large population increase and extra cycling infrastructure. Census data on cycling to work in Victoria shows cycling reduced from 24,022 in 1986 to 22,267 in 2021[99].
6) Clarke 2015 provided an evaluation of Australia’s bicycle helmet law and reported the disadvantages in health terms outweighed the potential benefits by 109 to 1[100]. The evaluation assumed helmets would prevent some head injuries but the overall effect on health was negative.
7) The level of penalty notices for not wearing started at $15 in 1990 and to follow inflation would be approximately $35 in 2023, however it is $240, a massive unjust increase. From court cases some prison sentences are imposed. The pre law assessment expected income from about 3000 fines per year. In the first 12 month 19,229 fines were issued, 20314 in 1997, 15,950 in 1999, and about 20,000 in 2003. Each year there has been a high level of police involvement, contributing to discouraging cycling in the longer term.
8) vCycling hospitalisions in Australia has increased by 97% from 1990 to 2021/22, and research has reported that helmet use increases the accident rate by between 14% and 40%[101].
9) The right to health is part of the Australian Constitution[102]. It has been recognised that cycling has a significant impact on fitness and mental health[103], .[104] The Victoria Parliament introduced cycle helmet law without assessing the societal health effects from reducing cycling and increased accident risk. Government guidance on health states[105],
The right to health is the right to the enjoyment of the highest attainable standard of physical and mental health.
The right to health comes under Article 12(1) of the International Covenant on Economic, Social and Cultural Rights (ICESCR).
10) Many people cycle for exercise, enjoyment, fun, commute, shopping, educational and making it has hassle free and enjoyable as possible is very important. With helmet law and enforcement comes police involvement and social pressure to conform with the law. Additionally, it results in an increased accident risk. Thus, impacting on people’s right to health i.e. ‘The right to health is the right to the enjoyment of the highest attainable standard of physical and mental health’.
Conclusions
Survey and census data show the helmet law discouraged cycling, especially for teenagers. The available evidence for Victoria shows a negative outcome for health, safety and social aspects with high level fines for not wearing cycle helmets. Evidence shows the health benefits of cycling far exceeds the injury consequences; therefore, the helmet law is having an overall negative effect on the health of people in Victoria and Australia.
The evidence for mandatory helmet use is not at all strong to warrant imposing fines, having regard to justice and human rights, and the individual and society. Cycling has not a high fatality risk or a high serious injury risk rate and according to research, the health benefits easily exceed the risks. If the risk level for the type of cycling undertaken is very high, then potentially it may be of benefit to wear helmets, however the risk level is generally low, as per the typical cyclist, then the added risks from helmets can increase the overall accident risk with more impacts and extra falls. The helmet laws in Victoria and in other parts of Australia are incompatible with the Constitution and human right of the enjoyment of the highest attainable standard of physical and mental health. Courts and judges should follow the principles of justice and the Constitution and where the law conflicts, with questionable requirements based on unreliable methods and unjust high-level fines, and jail terms, they should use their authority and decide based on justice and health for individuals. There is no sound basis for having the helmet law and it is not necessary. The Government of Victoria has failed in its duty of care to properly monitor and fully evaluate the consequences of the helmet law. The helmet law should be repealed. Plans to improve safety via education and cycle training should be strengthened.
Colin Clarke,
Private Researcher Colin Clarke (0000-0002-0685-9874) (orcid.org)
Email colinclarkecycling@hotmail.co.uk
Appendix A

-
https://www.sentencingcouncil.vic.gov.au/sacstat/magistrates-court/sr17-41-256-1-cyclist-fail-to-wear-an-approved-bike-helmet-mc.html ↑
-
https://www.aph.gov.au/About_Parliament/Senate/Powers_practice_n_procedures/Odgers_Australian_Senate_Practice/Chapter_20 ↑
-
Road Fatality Statistics Australia, 1992 FORS ↑
-
Safe roads for Children, Social Development Committee, Parliament of Victoria 1987. ↑
-
Traffic Accident Commission data provided to C Clarke 1993 ↑
-
Victorian Bicycling Strategy; Vic Roads, Australia 1990. ↑
-
Victorian Injury Surveillance System, Hazard Vol 6, Dec 1990 ↑
-
BICYCLE HELMET USAGE RATES IN VICTORIA 1983-1990 Vic Roads
-
Victorian Bicycling Strategy; Vic Roads, Australia 1990. ↑
-
Finch C, Heiman L, Neiger D; Bicycle Use and Helmet Wearing Rates in Melbourne, 1987 to 1992: The Influence of the Helmet Wearing Law; Report 45. Melbourne (Vic): MUARC, 1993. ↑
-
Robinson DL; Head injuries and bicycle helmet laws; Accid Anal Prev, 28, 4: p 463-475, 1996
-
Shepherd R, Helmet law discourages cycling, Australian Cyclist, Oct 1991 ↑
-
Victoria, Department of Transport, fees https://www.vicroads.vic.gov.au/safety-and-road-rules/road-rules/penalties/fines#fines ↑
-
https://www.cla.asn.au/News/bike-helmet-fines-are-enough-to-do-your-head-in/#:~:text=Professors%20Julia%20Quilter%20and%20Russell,Fair%20cop%20or%20unjust%20gouge%3F ↑
-
https://profile.id.com.au/australia/travel-to-work?WebID=110#:~:text=Victoria&text=On%20Census%20day%202021%20in,rode%20a%20bike%20or%20walked. ↑
-
http://cycle-helmets.com/senate-inquiry-comment.html ↑
-
Robinson D, Submission to Inquiry on Personal Choice and Community Safety, WA https://www.parliament.wa.gov.au/Parliament/commit.nsf/luInquiryPublicSubmissions/B6700C5BF56F2BB1482583280007ED13/$file/cs.ccs.089.181005.sub.Cycle-Safe.pdf ↑
-
https://new.parliament.vic.gov.au/hansard , PETITIONS SITTINGYEAR 1991, page 2531 ↑
-
Sullivan G, Wise A, Bicycle helmet usage rates in Victoria 1983 -1990, Vic Roads GR90-9 ↑
-
Lambert J. Number of cyclists, bicycle trips and bicyclist accident reports in Victoria, 1986-1989. Vic Roads internal report, May 1990. ↑
-
Newstead S, Cameron M, Gantzer S, Finch C, 1994, ‘Bicycle head injuries in Victoria, Three years after the introduction of mandatory use’ report no 75 MUARC, 1994. ↑
-
Janssen EG, Wisemans JSHM; Experimental and mathematical simulation of pedestrian –vehicle and cyclist-vehicle accidents; Proceedings of the 10th International Technical Conference on Experimental Safety Vehicles, Oxford July 1985. ↑
-
Robinson DL; Head injuries and bicycle helmet laws; Accid Anal Prev, 28, 4: p 463-475, 1996 http://www.cycle-helmets.com/robinson-head-injuries.pdf ↑
-
Clarke CF, The Case against bicycle helmets and legislation, VeloCity Munich, 2007. http://www.ta.org.br/site/Banco/7manuais/colin_clarke_cycle_helmet.pdf ↑
-
Erke A, Elvik R. Making Vision Zero real: Preventing Pedestrian Accidents And Making
Them Less Severe, Oslo June 2007. page 28. https://www.toi.no/getfile.php/Publikasjoner/T%d8I%20rapporter/2007/889-2007/889-2007-nett.pdf ↑
-
Clarke CF, Gillham C,(2019) Effects of bicycle helmet wearing on accident and injury rates, GB National Road Safety Conference, November 2019 https://www.researchgate.net/publication/337367329_Effects_of_bicycle_helmet_wearing_on_accident_and_injury_rates ↑
-
https://www.vicroads.vic.gov.au/safety-and-road-rules/cyclist-safety/wearing-a-bicycle-helmet ↑
-
Spaite DW, Murphy M, Criss EA, Valenzuela TD, Meislin HW, A prospective analysis of injury severity among helmeted and non helmeted bicyclists involved in collisions with motor vehicles. Journal of Trauma, 1991;31(11):1510-6 ↑
-
Bambach, M; Mitchell RJ, Grzebieta RH, Olivier J (April 2013). “The effectiveness of helmets in bicycle collisions with motor vehicles: A case-control study.“. Accid Anas and Prev. 53: 78–88. doi:10.1016/j.aap.2013.01.005. PMID 23377086. ↑
-
Whately S, Bicycle Crashes in the Austrian Capital Territories, CR 35, FORS, 1985, Table 25
http://www.infrastructure.gov.au/roads/safety/publications/1985/pdf/Bic_Crash_1.pdf accessed 11.1.2014 ↑
-
Dinh MM, Kastelein C, Hopkins R, Royle TJ, Bein KJ, Chalkley DR, Ivers R. Mechanisms, injuries and helmet use in cyclists presenting to an inner city emergency department. Emerg Med Australas. 2015 Aug;27(4):323-7. doi: 10.1111/1742-6723.12407. Epub 2015 May 4. ↑
-
Clarke CF, Evaluation of Australia’s bicycle helmet laws, The Sports Science Summit, O2 venue London UK http://www.cycle-helmets.com/au-assessment-2015.pdf Presented 14 January 2015 ↑
-
Whately S, Bicycle crashes in the Australian Capital Territories, CR35,Federal Office of Road Safety, 1985. ↑
-
National Center for Statistics & Analysis (NCSA) data provided to C Clarke, 25 Aug 2023 ↑
-
Clarke CF, Weaknesses with a Meta-Analysis Approach to Assessing Cycle Helmets, 2017 https://trid.trb.org/view/1491227
-
A case-control study of the effectiveness of bicycle safety helmets (cyclehelmets.org) ↑
-
A case-control study of the effectiveness of bicycle safety helmets (cyclehelmets.org) ↑
-
Zeegers T, Overestimation of the effectiveness of the bicycle helmet by the use of odds ratios’ http://www.fietsberaad.nl/?lang=nl&repository=overestimation+of+the+effectiveness+of+the+bicycle+helmet+by+the+use+of+odds+ratios ↑
-
Teschke K, Koehoorn M, Shen H, et al. Bicycling injury hospitalisation rates in Canadian jurisdictions: analyses examining associations with helmet legislation and mode share. BMJ Open 2015;5:e008052. doi:10.1136/bmjopen-2015- 008052 ↑
-
Curnow B, A Scientific Evaluation; Bicycle Helmets, https://www.cyclehelmets.org/papers/p787.pdf ↑
-
StClair VJ, Chinn BP, (2007) Transport Research Laboratory. Assessment of current bicycle helmets for the potential to cause rotational injury (trb.org) )Accessed 18/02/2022) ↑
-
Webman R, Dultz LA, Simon RJ et al. Helmet use is associated with safer bicycling behaviors and reduced hospital resource use following injury. J Trauma Acute Care Surg 2013;75:877–81. ↑
-
Wachtel A, Lewiston D, Risk Factors for Bicycle-Motor Vehicle Collisions at Intersections http://www.bicyclinglife.com/Library/riskfactors.htm ↑
-
Airaksinen N, Luthje P, Nurmi-Luthje I. Cyclist injuries treated in Emergency Department (ED): Consequences and costs in South- Eastern Finland in an area of 100 000 inhabitants. Association for the Advancement of Automotive Medicine 54th Annual Scientific Conference; 17October 2010. Las Vegas, NV, Association for the Advancement of Automotive Medicine, 2010. ↑
-
Crocker P, Zad O, Milling T, Lawson KA, Alcohol, bicycling, and head and brain injury: a study of impaired cyclists’ riding patterns, American Journal of Emergency Medicine, 2010;28(1):68-7 ↑
-
Harada MY, Gangi A, Ko A et al. Bicycle trauma and alcohol intoxication. Int J Surg (Lond) 2015;24:14–19. ↑
-
Sethi M, Heidenberg J, Wall SP et al. Bicycle helmets are highly protective against traumatic brain injury within a dense urban setting. Injury 2015;46:2483–90. ↑
-
Dinh MM, Kastelein C, Hopkins R, Royle TJ, Bein KJ, Chalkley DR, Ivers R. Mechanisms, injuries and helmet use in cyclists presenting to an inner city emergency department. Emerg Med Australas. 2015 Aug;27(4):323-7. doi: 10.1111/1742-6723.12407. Epub 2015 May 4 ↑
-
Gaudet L, Romanow NTR, Nettel-Aguirre A, Voaklander D, Hagel, Rowe BH,
The epidemiology of fatal cyclist crashes over a 14-year period in Alberta, Canada, BMC Public Health 201515:1142 DOI: 10.1186/s12889-015-2476-9
http://bmcpublichealth.biomedcentral.com/articles/10.1186/s12889-015-2476-9 ↑
-
Forbes AE, Schutzer-Weissmann J, Menassa DA, Wilson MH (2017) Head injury patterns in helmeted and non-helmeted cyclists admitted to a London Major Trauma Centre with serious head injury. PLoS ONE 12(9): e0185367. https://doi.org/10.1371/journal.pone.0185367 ↑
-
Li G, Baker SP, Smialek JE, Soderstrom CA. Use of alcohol as a risk factor for bicycling injury. https://www.ncbi.nlm.nih.gov/pubmed/11180732/ ↑
-
Twisk DAM, ∗, Martine Reurings M, An epidemiological study of the risk of cycling in the dark:
The role of visual perception, conspicuity and alcohol use, Accid Anal and Prev. 60 (2013) 134– 140 ↑
-
Sethi M, Heidenberg J, Wall SP et al. Bicycle helmets are highly protective against traumatic brain injury within a dense urban setting. Injury 2015;46:2483–90. ↑
-
McGuire L and Smith N,(2000) Cycling safety: injury prevention in Oxford cyclists, Injury Prevention 2000;6:285–287 ↑
-
Robinson DL; Head injuries and bicycle helmet laws; Accid Anal Prev, 28, 4: p 463-475, 1996
-
Morgan M, Sullivan G, Nassau F, Rogerson P Peberdy P, Anderson A, Leicester P, Bicycle helmet usage rates in Victoria;1990 -1991, Vic Roads Report GR91-9 ↑
-
Robinson DL; Head injuries and bicycle helmet laws; Accid Anal Prev, 28, 4: p 463-475, 1996
-
Hutchinson, TP, Kloeden, CN, Long, AD, Bicycle crashes in South Australia, 2008 https://digital.library.adelaide.edu.au/dspace/bitstream/2440/49072/2/hdl_49072.pdf (2008, accessed 20 February 2021). ↑
-
Robinson D, Submission to Inquiry on Personal Choice and Community Safety, WA https://www.parliament.wa.gov.au/Parliament/commit.nsf/luInquiryPublicSubmissions/B6700C5BF56F2BB1482583280007ED13/$file/cs.ccs.089.181005.sub.Cycle-Safe.pdf ↑
-
Clarke CF, Is cycle helmet promotion warranted, July 2022 Edinburgh Napier University.
https://www.researchgate.net/publication/361798342_Is_cycle_helmet_promotion_warranted ↑
-
Road trauma Australia 2016 statistical summary, https://bitre.gov.au/publications/ongoing/files/Road_Trauma_Australia_2016_Web.pdf ↑
-
Fishman, E., et al., Barriers to bikesharing: an analysis from Melbourne and Brisbane. Journal of Transport Geography, 2014. 41: p. 325-337. ↑
-
https://www.cycle-helmets.com/leyonhjelm-helmets.html ↑
-
https://www.aph.gov.au/Parliamentary_Business/Committees/Senate/Economics/Personal_choice/Interim%20report%20d/c05 ↑
-
Clarke CF, Gillham C,(2019) Effects of bicycle helmet wearing on accident and injury rates, GB National Road Safety Conference, November 2019 https://www.researchgate.net/publication/337367329_Effects_of_bicycle_helmet_wearing_on_accident_and_injury_rates ↑
-
Feler J, Maung AA, O’Connor R, et al Sex-based differences in helmet performance in bicycle trauma
J Epidemiol Community Health 2021;75:994-1000 ↑
-
https://globalsportmatters.com/health/2019/08/27/aiba-drops-headgear-male-amateur-boxers-female-fighters-wear-them/ ↑
-
Cycling UK,(2017) Health and Cycling https://www.cyclinguk.org/campaigning/views-and-briefings/health-and-cycling (Accessed 1 May 2022) ↑
-
https://s23705.pcdn.co/wp-content/uploads/2021/05/Bicycle-Network-Bike-rider-fatality-report_2020.pdf ↑
-
https://www.statista.com/statistics/992270/total-number-cyclist-deaths-australia/ ↑
-
https://www.aihw.gov.au/reports/overweight-obesity/overweight-and-obesity/contents/overweight-and-obesity ↑
-
Clarke CF, Evaluation of Australia’s bicycle helmet laws, The Sports Science Summit, O2 venue London UK http://www.cycle-helmets.com/au-assessment-2015.pdf Presented 14 January 2015 ↑
-
Cycling UK,(2017) Health and Cycling https://www.cyclinguk.org/campaigning/views-and-briefings/health-and-cycling (Accessed 1 May 2022) ↑
-
Cadilhac, D.A., Cumming, T.B., Sheppard, L. et al. The economic benefits of reducing physical inactivity: an Australian example. Int J Behav Nutr Phys Act 8, 99 (2011). https://doi.org/10.1186/1479-5868-8-99 9 ↑
-
https://www.sentencingcouncil.vic.gov.au/sacstat/magistrates-court/sr17-41-256-1-cyclist-fail-to-wear-an-approved-bike-helmet-mc.html ↑
-
https://www.reidcycles.com.au/blogs/news/fines-for-not-wearing-a-bike-helmet-in-each-australian-state ↑
-
https://www.uow.edu.au/media/2019/over-the-top-policing-of-bike-helmet-laws-targets-vulnerable-riders.php#:~:text=Riding%20a%20bike%20without%20a,million%20were%20issued%20to%20cyclists. ↑
-
https://www.ag.gov.au/rights-and-protections/human-rights-and-anti-discrimination/human-rights-scrutiny/public-sector-guidance-sheets/right-health ↑
-
British Medical Association, Cycling towards Health and Safety, 1992 ↑
-
Right to health | Attorney-General’s Department (ag.gov.au) ↑
-
Cycling UK,(2017) Health and Cycling https://www.cyclinguk.org/campaigning/views-and-briefings/health-and-cycling (Accessed 1 May 2022) ↑
-
Clarke CF, Evaluation of Australia’s bicycle helmet laws, The Sports Science Summit, O2 venue London UK http://www.cycle-helmets.com/au-assessment-2015.pdf Presented 14 January 2015 ↑
-
Heady freedom as judge agrees helmet laws are unnecessary http://www.smh.com.au/nsw/heady-freedom-as-judge-agrees-helmet-laws-are-unnecessary-20100827-13vz2.html accessed 25.9.2014 ↑
-
The only proven thing helmets protect us from are fines
http://www.theguardian.com/environment/bike-blog/2012/nov/13/helmets-australia accessed 21.11.2014 ↑
-
Finch C, Heiman L, Neiger D; Bicycle Use and Helmet Wearing Rates in Melbourne, 1987 to 1992: The Influence of the Helmet Wearing Law; Report 45. Melbourne (Vic): Accident Research Centre, Monash University, 1993. ↑
-
Garrard J. Active transport: Children and young people, An overview of recent evidence, Dec 2009, Table 1
http://www.chpcp.org/resources/Active_transport_children_and_young_people_FINAL.pdf
accessed 5.8.2014 ↑
-
Ironmonger, D.S and Norman, P (2007) “Travel Behaviour of Women, Men and Children:What Changes and What Stays the Same?”
http://www.transport.vic.gov.au/__data/assets/pdf_file/0007/31210/Travel-behaviour-of-WomenMenChildren_IATUR-paper.pdf ↑
-
Hume C, What influences whether children walk or cycle to school?
http://www.deakin.edu.au/health/cpan/reports-downloads/02-book-reports/files/Influences%20to%20childrens%20travels%20to%20school.pdf accessed 30.9.2014 ↑
-
Morgan M, Sullivan G, Nassau F, Rogerson P Peberdy P, Anderson A, Leicester P, Bicycle helmet usage rates in Victoria;1990 -1991, Vic Roads Report GR91-9. ↑
-
Lambert J. Number of cyclists, bicycle trips and bicyclist accident reports in Victoria, 1986-1989. Vic Roads internal report, May 1990. ↑
-
McDermott FT, Klug GL Differences in head injuries of pedal cyclist and motorcyclist casualties in Victoria. The Medical Journal of Australia[1982, 2(1):30-32 ↑
-
Clarke CF, The Case against bicycle helmets and legislation, VeloCity Munich, 2007. http://www.ta.org.br/site/Banco/7manuais/colin_clarke_cycle_helmet.pdf ↑
-
TAC data provided to C Clarke 1993. ↑
-
North B, Oatey P, Jones N, Simpson D, Head injuries from road accidents – a diminishing problem? MJA Vol 158, March 151993. ↑
-
Cycling UK,(2017) Health and Cycling https://www.cyclinguk.org/campaigning/views-and-briefings/health-and-cycling (Accessed 1 May 2022) ↑
-
Robinson DL; Head injuries and bicycle helmet laws; Accid Anal Prev, 28, 4: p 463-475, 1996
-
https://profile.id.com.au/australia/travel-to-work?WebID=110 ↑
-
Clarke CF, Evaluation of Australia’s bicycle helmet laws, The Sports Science Summit, O2 venue London UK http://www.cycle-helmets.com/au-assessment-2015.pdf Presented 14 January 2015 ↑
-
Clarke CF, Gillham C,(2019) Effects of bicycle helmet wearing on accident and injury rates, GB National Road Safety Conference, November 2019 https://www.researchgate.net/publication/337367329_Effects_of_bicycle_helmet_wearing_on_accident_and_injury_rates ↑
-
https://www.ag.gov.au/rights-and-protections/human-rights-and-anti-discrimination/human-rights-scrutiny/public-sector-guidance-sheets/right-health ↑
-
British Medical Association, Cycling towards Health and Safety, 1992 ↑
-
https://www.sustrans.org.uk/our-blog/get-active/2020/everyday-walking-and-cycling/why-cycling-and-walking-are-great-for-your-mental-health/ ↑
-
Right to health | Attorney-General’s Department (ag.gov.au) ↑
han 30 years later, the real world evidence can be considered.
A significant feature of the Australian Constitution, and one which is essential for good government, is that the judicial function is separated from the legislative and executive functions, and the judicial power is vested in independent judges with security of tenure. The Constitution provides for federal courts not only to interpret and apply the law in determining issues between governments and persons and between persons, but, by interpreting and applying the Constitution to such issues, thereby to determine the lawfulness of the actions of the legislative and executive branches of government. It is therefore doubly important that the judges have complete independence from the other two branches[2]. When cyclists are fined for not wearing helmets it is important that the justice system considers carefully the reasons provided in their defence and if a reasonable doubt exists about helmet benefit or the health consequences, they take this into account.
Background
In the early 1980s Australia had a road fatality rate of about 22 per 100,000 population and efforts to improve road safety were being made. By 1989 the rate was 16.5 per 100,000 population[3]. Schools were providing bike education courses to encourage safe riding behaviour[4]. Cycle helmet promotion and legislation was promoted. Transport Accident Commission (TAC) data from Victoria[5] for head injury claims by bicyclists involved in motor vehicle accidents detailed that most were aged less than 18 years of age in the period 1987-1989 – see Table 1 (added Melbourne cycling exposure 1987/88 data – refer Fig 9 Cameron 1992 and Fig 27, Finch 1993).
|
Age |
Head |
Concussion |
Hd + Conc |
Total claims |
Percent Hd+Conc |
Approximate exposure, billions of seconds per week |
|
0-11 |
48 |
27 |
75 |
514 |
14.6 |
5-6 |
|
12-17 |
82 |
45 |
127 |
1162 |
10.9 |
9-11 |
|
18+ |
40 |
22 |
62 |
812 |
7.6 |
5-6 |
|
total |
170 |
94 |
264 |
2488 |
10.6 |
20-24 |
Table 1 TAC head injury claimants 1987-89
Data from the 1980s for Australia was used to assess the rate of serious injury per 10 million km[6] cycled. It varied by age group as shown in Table 2. The ‘All’ rate was 39 for males and 21 for females. On average, one injury equated to approximately 285,000 km cycled, that is a low risk The percentage of travel is shown for comparison.
|
Age |
9-10 |
11-13 |
14-17 |
18-29 |
30-60 |
60-64 |
65 + |
All |
|
Rate |
107 |
45 |
32 |
16 |
22 |
12 |
110 |
35 |
|
% travel |
3.8 |
16 |
35.5 |
25.4 |
16.1 |
2.4 |
0.8 |
100 |
|
Rate x % travel |
4.07 |
7.20 |
11.36 |
4.06 |
3.54 |
0.29 |
0.86 |
31.38 |
|
totals |
22.63 |
8.75 |
31.38 |
|||||
Table 2 Approximate serious injury rate per 10 million km
The serious injury rate per 10 million km for those 18 and older was probably about 20% of the total, with data for the 1-8 age group not published.
Proportion of children’s injuries
VISS data from Victoria[7] provided information on the distribution of injuries for children younger than 15 years of age, as shown in Figure 1.
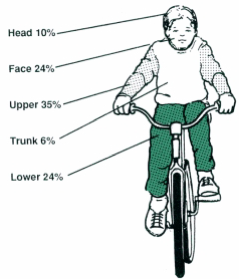
Figure 1
Helmet wearing rates
Vic Roads had conducted annual surveys of the wearing rates from 1983 to 1990[8]. For primary schoolchildren the rate had increased in each year but for secondary it had reduced in the Melbourne area in 1988 and 1989. For adults the highest wearing rates reported was 46% for commuters in Melbourne and the lowest for recreational in country areas at 10%[9].
Victoria cycle helmet legislation
In 1990 prior to the law being introduced 1st July, a cost assessment (Regulatory Impact Statement) of the law was provided. It assumed reduced head injury rates would be one effect, but no consideration or assessment was given to if cycling would reduce due to the helmet requirement and the potential health consequences. Surveys from 1990 and 1991 shows the major effect from the legislation with a drop of 36% in the numbers cycling in Melbourne[10] – see Figure 2. Post law in 1991, 10% extra wore helmets compared to 36% fewer people cycling. It is evident that it had discouraged cycling, which was in sharp contrast to seat belts which did not discourage driving. A before-law survey in Melbourne showed that 272 out of 1293 teenagers (12-17yrs) wore helmets. In 1991 after the law was enforced, 302 wore helmets out of 670, i.e. 30 extra wore helmets compared with 623 fewer cycling.

Figure 2 Changes pre to post law for Melbourne
Note: Figure 3 is based on data from Table 4, Robinson 1996[11] – 1110 fewer cyclists and 297 extra wearing helmets.
A major criticism of the law in 1991 was that it had reduced cycling levels and one article, ‘Riding numbers plummet‘[12] reported that it seemed people who did not want to wear them had ceased cycling altogether – refer Appendix A. With police enforcement there was a total of 19229 fines in the first 12 months for Victoria. A typical fine was $15 in 1991 compared with $240 in 2023[13]. To follow inflation the $15 should be approximately $35[14]. Professors Julia Quilter and Russell Hogg stated ‘the fines are way too high and begging to be abused by police. They can have long-term deleterious effects on children and families, especially the poor[15]’.
Census data for Australia indicates that helmet laws discouraged cycling over an extended period, as shown in Table 3, refer Figures 3 and 4. For Victoria in 2021 the rate was 0.7 and actual number dropped, from 33965 in 2016 to 22267 in 2021[16].
|
Year |
1986 |
1991 |
1996 |
2001 |
2006 |
2011 |
2016 |
2021 |
|
% cycling to work |
1.68 |
1.56 |
1.24 |
1.21 |
1.24 |
1.29 |
1.24 |
0.7 |
Census cycling data for Australia Table 3

Figure 3[17]

Figure 4 (From submission by Dorothy Robinson to WA Inquiry[18])
Petition to Victoria’s Parliament
On 28 May 1991 a petition[19] was presented to the Parliament, ‘Safety helmets for bicyclists’. It stated,
To the Honourable the Speaker and members of the Legislative Assembly in
Parliament assembled:
The humble petition of the undersigned citizens of Australia respectfully showeth:
That your petitioners are gravely concerned that the introduction of the
bicycle helmet wearing mandatory regulation has the effect of increasing the
risk of having an accident by the combined reasons of 1 to 7 as listed:
1. Increased fatigue due to the extra weight on the head.
2. Increase in head temperature.
3. Giving the rider a higher centre of gravity, making turning less stable.
4. Peripheral vision reduction in some cases.
5. Noise effects: many cyclists experience noise increase which reduces
their awareness of approaching traffic.
6. Reduction in the head’s ability to move quickly in observing traffic,
due to increased weight and chin strapping.
7. Having a feeling or sense of being safe, reducing caution and taking
increased risks.
The combined risks of 1 to 7 being reflected in the Victorian accident statistics for years 1984-8 as cyclists aged 17-50 years old had a 119 per cent increase in accidents.
Your petitioners most humbly pray that the Parliament will change the law to ensure that for bicyclists over eighteen years old there is no legal requirement to wear a helmet.
And your petitioners, as in duty bound, will ever pray.
By Mr Wallace (1005 signatures)
Laid on table.
Victoria’s Parliament made on response to the petition, it was not disputed.
Increased accident rate with helmet use
Reportedly 48.8%[20] of adult commuters in Melbourne were wearing helmets in 1989 and for Victoria, cycling increased by 47% between 1986 and 1989[21]. Census data for Victoria shows similar cycling levels for 1981 and 1986, 1.79% v 1.75%. The 119% increase in the accident rate for adults in the 17-50 age range between 1984-88 is therefore a serious concern at a time of increased helmet wearing. The increase in accidents being much higher than the increase in cycling levels.
Cameron et al 1994[22] provided details of TAC data (from motor vehicle/cyclist accidents) with the percentage reduction in severe bicyclist casualties relative to the 1989/90 financial year. For Melbourne, (Table 4, in report, copied below) bicyclists without head injuries fell by 4% and 12% for the years 1990/91 and 1991/92. Cycling was generally reduced by 35.6% compared to the reported 4% and 12% reductions, meaning the accident rate increased by approximately 36.6% relative to cycling levels, i.e. (1-0.12=088)/(1-0.356=0.64) = 1.366

In 2013 Vic Roads reported ‘Two years after the legislation was introduced, there was a 16% reduction in head injuries in metropolitan Melbourne and a 23% reduction in head injuries throughout Victoria’. It should be noted the overall road toll from 1989 to 1992 for Victoria reduced from 777 to 396, so safer road behaviour occurred, reportedly due to reduced speeding and lower levels of drink driving. Lower impact speeds can result in significantly lower head injury severity for bicyclists according to research by Janssen and Wisemans 1985[23]. From 1990 to 1992 TAC data also shows a reduction in the head injury rate for pedestrians. Teenagers with the highest serious injury ‘rate/travel figure of 11.36 (Table 2), and the largest group for TAC claims (Table1), were significantly discouraged from cycling by the law, 45% to 48% reported. TAC accident data 1987-89 from Victoria, Table 1, shows the younger aged groups to have a higher proportion of head / concussion injuries. The 12-17 age group had the highest TAC number of claims, and they had the largest reductions in cycling, so it would be expected for head injuries to reduce.
Robinson’s 1996 reported[24] injury data for children from Victoria and New South Wales. In Victoria, the equivalent injury numbers for pre-law levels of cyclist numbers increased from 809 to 944, a 16% increase from 1990 to 1992 (see Table 5 in study). Robinson’s data in Table 2 for children in NSW shows the equivalent number of injuries increased from 1,310 (384 head + 926 other injuries) pre law in 1991 to 2,083 (488 head + 1,595 other injuries) in 1993. The relative injury rate proportional to cycling levels increased 59% from 1,310 to 2,083. The relative increase for ‘other’ injuries was 72% and for ‘head’ was 27%, refer. Robinson refers to the Wasserman data that detailed the incidence of cyclists hitting their head/helmet during an 18-month period was “significantly higher for helmet wearers (8/40 vs 13/476 – i.e. 20% vs 2.7%, p 0.00001).” A bare head width of approximately 150mm may avoid contact compared to a helmeted head at approximately 200mm wide (Clarke 2007[25]). Assuming the 20% and 2.7% figures are typical, on a yearly average for helmeted and non-helmeted the risk of hitting their helmet or head would be 13.2% and 1.8% respectively. The increased risk of impact for helmets is about seven times higher. A degree of protection could be expected plus a degree of risk from the extra impacts.
Erke and Elvik 2007[26] examined research from Australia and New Zealand and stated that “There is evidence of increased accident risk per cycling-km for cyclists wearing a helmet. In Australia and New Zealand, the increase is estimated to be around 14 per cent.”
Clarke and Gillham 2019[27] reported, ‘Published studies and research within this paper from jurisdictions with all-age, child and/or adult mandatory helmet jurisdictions consistently suggest reductions in cycling participation when laws are enforced but either no corresponding decrease in hospitalised total injuries or an increase in all-body injuries. Further, there is strong evidence that helmeted cyclists suffer a higher rate of upper body limb injuries than non-wearers, suggesting a higher rate of falls than non-wearers. Bicycle helmet wearing globally has increased over the past 30 years via promotion and in some cases legislation. Various reports have assessed the changes in wearing rates, accidents, injuries and cycling activity levels. A limited number of reports have analysed overall changes in accident risk per kilometres cycled, per hours cycled or in relationship to cycling levels via survey information. A significant number of findings suggest a higher accident/injury rate may result from helmet usage. Accident data from Australia, the United States, Canada, the United Kingdom and New Zealand indicate the accident rate per hour cycled or per miles cycled has increased with greater helmet usage, most likely from a greater proportion and number of upper limb injuries. Consideration is given to why the accident rate may change and if overall safety is improved or reduced by helmet usage’.
Support for helmet legislation
Vic Roads quotes evidence in support of legislation[28], stating.
Research
Research indicates that bike helmets greatly reduce the risk of head injuries, which are the major cause of death and injury to bike riders. A comprehensive systematic review of 40 studies was published in the prestigious International Journal of Epidemiology in 2016 and found that bicycle helmets reduce the chances of a serious head injury by almost 70 %.
Examining Vic Road’s evidence
The 40 studies are ‘case-control studies’ that do not estimate risk per hour or km cycled, they are based on comparing injuries for helmeted v non-helmeted. From the 40 studies, 30 related to serious head injuries. Two of the 30 studies reported that non-wearers were involved in more severe impacts, Spaite 1991 (USA) and Bambach et al 2013 (NSW).
Spaite 1991[29] stated, ‘However, a striking finding was noted when the group of patients without major head injuries was analysed separately. Helmet users in this group had much less serious injuries than non-users. The researchers concluded that helmet non-use is strongly associated with serious injuries even if those without serious head injuries are excluded. This implies that non-users of helmets tend to be in higher impact crashes than helmet users, since the injuries suffered in body areas other than the head also tend to be much more severe. It is possible that at least some of the ‘protection’ afforded helmet wearers in previous studies may be explained by safer riding habits rather than solely a direct effect of the helmets themselves’.
Bambach et al[30] reported; ‘Non-helmeted cyclists were more likely to display risky riding behaviour, however, were less likely to cycle in risky areas; the net result of which was that they were more likely to be involved in more severe crashes’. Bambach et al reported some of the differences between helmet wearers and non-wearers for cycle accidents with motor vehicles involved, as shown in Table 5. e.g. 55% of those not wearing a helmet were in the age 0-19 yrs. Disobeying traffic control and having a BAC over 0.5 comprised 16.6% for the no-helmet group compared with 5% for helmeted. Bambach et al did not provide details of wearing hi-visibility attire or on the use of lights.
|
No helmet |
Helmet |
|
|
Age 0-19 |
55% |
18.5% |
|
Disobeying traffic control |
9.4% |
3.3% |
|
BAC over 0.5 |
7.2% |
1.7% |
|
Riding on footpath |
34.4% |
12.9% |
|
Serious injury other than head |
9.5% |
7.3% |
|
Not in daytime |
27.9% |
23.3% |
Table 5
BAC – blood alcohol content
From the 30 serious head injury studies, 6 provided adults only data, Dinh 2010 et al, Dinh 2013 et al, Dinh et al 2015, Crocker et al 2012, Wagner et al 2012 and Zibung et al 2014. Wagner et al (USA) data showed an increased risk of serious head injury. From the 5 helmet favourable reports, 3 from Sydney Australia, 2 from USA and 1 from Sweden. Dinh et al reported a higher rate of falls for helmeted, and for non-helmeted a higher proportion that had been drinking, detailing in one study that 2% of helmeted had been drinking v 20% for non-wearers. Crocker et al detailing 1.5% v 33.4% (alcohol and drug use) and Zibung et al 7.9% v 32% (alcohol) had similar findings for drinking alcohol with non-wearers at much higher levels. Crocker stated.
Alcohol use and head or brain injury continued to demonstrate positive correlation in both the helmet-wearing and non-helmet-wearing groups independently (p < 0.05 and p < 0.005, respectively), indicating that alcohol use is linked to increased likelihood of a head or brain injury whether or not the rider is wearing a helmet.
Bicycle alone accidents result in a higher proportion of arm fractures than bicycle/motor vehicle accidents.[31] With a higher fall off rate comes a lower rate of serious head injury. Dinh et al reported 62% of helmeted having upper limb injuries v 41% for non-wearers[32]. Similar data was reported from Queensland that Clarke 2015[33] refers to, ‘Monograph 5 Table 14 shows helmet wearers to have a ‘Shoulder/Upper limb’ rate of 28.3% and non-wearers a rate of 18.4%.’Therefore helmet wearers may have had a larger proportion of injuries due to bicycle alone type accidents or falls. Cyclist head injuries due to falls have been reported to have about half the average length of hospital stay compared with cyclists involved in collisions with motor vehicles[34]. This provides another reason why a lower proportion of serious head injuries is sometimes reported for helmeted cyclists.
USA data shows helmet wearers are much more likely to use lights at night[35]. Because of the differences in behaviour and alcohol use the 5 studies do not constitute sound evidence that helmet use provides an overall safety benefit. Clarke 2017[36] examined the meta-analysis and the 40 studies and concluded, ‘A meta-analysis by Olivier and Creighton includes reports that compare the proportion of head injuries or other injuries for wearer vs non-wearers. Weaknesses in this approach stem from the combined effect of issues which affect both the accident rate and head injury rate for helmeted vs non-helmeted or not fully being able to evaluate the differences that occur. The meta-analysis claims that helmet use is associated with odds reductions of 51% for head injury, 69% for serious head injury, 33% for face injury and 65% for fatal head injury. When examined in detail, all were found to be unreliable claims due to weaknesses of the supporting evidence and methodology’.
The USA 1989 Seattle study[37] ‘A case-control study of the effectiveness of bicycle safety helmets’. Cyclehelmets.org reports, support by government agencies for the study was withdrawn[38]. This study claimed helmets reduce head injuries by 85% and gave weight to introducing legislation. Further Postscript – support for study withdrawn by Government agencies
In June 2013, US federal agencies The National Highway Traffic Safety Administration (NHTSA) and the Centers for Disease Control (CDC) decided that they could no longer justify citing the claim by this research that bicycle helmets reduce the risk of head injury by 85%. The agencies had been challenged under the Data Quality Act to show why they ignored later research, none of which had produced such convincing results. (GGW, 2013)
Recent studies have cast doubt on the reliability of published case control studies and meta-analyses regarding the effectiveness of bicycle helmets. Zeegers 2015[39] states that “Three cases could be found in the literature with sufficient data to assess both risk ratios and odds ratios: the Netherlands, Victoria (Australia) and Seattle (U.S.A). In all three cases, the problem of overestimation of the effectiveness of the helmet by using odds ratios did occur. The effect ranges from small (+ 8 %) to extremely large (> + 400 %). Contrary to the original claim of these studies, in two out of three cases the risk of getting a head injury proved not to be lower for helmeted cyclists. Moreover, in all three cases the risk of getting a non-head injury proved to be higher for cyclists with a helmet.”
Zeegers estimated the 1989 study overestimated the effectiveness of helmets by 400%. Nearly all the 40 studies used the same approach as the Seattle study, so most of them may have overestimate the effectiveness of helmets. The case control studies do not match the real world bigger picture of population results, for example in 2015 Teschke et al reported, ‘Helmet legislation was not associated with reduced hospitalisation rates for brain, head, scalp, skull or face injuries, indicating that factors other than helmet laws have more influence on injury rates’. [40]
Baschera et al 2021 study from Western Australia of 15yo+ cyclists, 2008-2015, who were admitted to the Royal Perth Hospital trauma unit found 88% of TBIs were mild among both helmet wearers and non-wearers, 3% were moderate among helmet wearers vs 10% among non-wearers, and 9% were severe among helmet wearers vs 2% among non-wearers. Among the 461 helmet wearers, 10 suffered severe TBI (2.16%). Among the 144 non-wearers, one suffered severe TBI (0.69%). The Baschera et al study shows 32.6% of non-helmet patients were affected by alcohol compared to 3.2% among helmeted cyclists, confirming other research showing significantly higher alcohol influence among injured non-helmet cyclists.
Curnow[41] provided a scientific evaluation of bicycle helmets and recognised the importance of minimising rotational acceleration. StClair and Chinn (2007)[42] reported ‘However, in both low speed linear impacts and the most severe oblique cases, linear and rotational accelerations may increase to levels corresponding to injury severities as high as AIS 2 or 3, at which a marginal increase (up to 1 AIS interval) in injury outcome may be expected for a helmeted head.’ This indicates that helmets may contribute to a worse outcome from falls at low speeds, common when a fall is due to a foot slipping off the pedals for example.
Different behaviour reported between helmeted and non-helmeted cyclists.
Table 6 below shows there are often major difference in behaviour between helmet wearers and non-wearers that would often increase the accident risk for non-wearers, supporting the findings of Spaite 1991 and Bambach et al 2913 that reported more severe impacts. Cyclists with helmets were more likely to use other safety measures, avoid alcohol use and use lights. Those without helmets were more likely to be at higher risks of severe accident and head injury due to several factors.
|
Reported differences |
Helmeted |
No helmet |
Reference |
Risk factor |
|
Riding against flow of traffic |
2.8% |
12.3% |
Webman et al 2013[43] |
3.6 to 6.6[44] |
|
Crossing against signals |
5.5% |
12.3% |
Webman et al 2013 |
n.a. |
|
Alcohol use |
0% |
31% |
Airaksinen et al 2010[45] |
n.a. |
|
Alcohol or drug use |
1.5% |
33.4% |
Crocker et al 2012[46] |
n.a. |
|
Alcohol use |
6.3% |
11.1% |
Webman et al 2013 |
n.a. |
|
Alcohol use |
7.9% |
32% |
Zibung et al 2014 |
n.a. |
|
Alcohol use |
4.7% |
22.2% |
Harada et al 2015[47] |
n.a. |
|
Alcohol use |
6.2% |
20.2% |
Sethi 2015[48] |
n.a. |
|
Alcohol use |
2.0% |
20% |
Dinh et al 2015[49] |
n.a. |
|
Alcohol use – Canada fatality data |
4.0% |
33% |
Gaudet et al 2015[50] |
n.a. |
|
Alcohol use – UK data |
7.4% |
18.6% |
Forbes 2017[51] |
.n.a. |
|
Alcohol use, average 9 above |
4.4% |
24.6% |
Ratio 1:5.6 |
Up to 20[52] |
|
Time of accident 8:01pm to 5:00am |
7.9% |
37.1% |
Crocker et al 2012 |
2-5 range for NL[53] |
|
Time of accident 9:00pm to 5:59am |
14.4% |
23.6% |
Sethi et al 2015[54] |
2-5 range for NL |
|
Use of electronic devices |
7.9% |
13.7% |
Sethi et al 2015 |
n.a. |
|
Skill level – beginner |
3.2% |
12.5% |
Crocker et al 2012 |
n.a. |
|
Wearing high visibility clothing -UK |
27.9% |
3.5% |
McGuire et al 2000[55] |
n.a. |
|
Using front and rear lights -UK data |
52.9% |
37.5% |
McGuire et al 2000 |
n.a. |
Table 6
Examples from helmet laws, when enforced, reducing cycling.
Details below show evidence of reduced cycling from the helmet laws. Comparing adult pedestrian to cyclist deaths, show a reduction in safety, compared with cycling levels.
1)
Melbourne surveys, pre to post helmet law, showed 30 more teenagers wearing helmets compared with 623 fewer cycling, a drop of 48%, with 20 fewer cycling for each extra one wearing a helmet[56].
2)
Morgan et al provided details of adult commuters counted in 1990 and 1991 – 5162 and 3226, a drop of 37%. They also detailed numbers counted at recreational sites – 2494 in 1990 and 1479 in 1991, a drop of 41%[57].
3)
For children in New South Wales after their helmet law, 569 extra wearing helmets compared with 2658 fewer counted[58]. Adults at rural road sites had a reduction of 37.6% from 1990 to 1993. Wet weather in the first survey affecting coastal cycling level. For adults counted at road sites a 25.9% reduction occurred from 1991 to 1993, from 5734 down to 4251.
4)
Adelaide surveys from 1986 to 1999 shows the numbers of trips by bicycle per day reducing from 890,000 to 400,000’[59], representing a reduction of 55%. Brisbane, Perth and Adelaide census counts for cycling to work in 1991 and 1996 shows a drop from 20054 to 14903, representing an approximate 30% drop when population growth is included.
5)
Perth cycle-way counts also show reduced cycling. Automatic counters installed on two key cyclist bridges in Perth over the Swan River recorded an average of 16,326 cycle movements weekly for the three months October to December 1991 (pre-law). The same months in the post law years 1992-94 recorded 13067, 12470 and 10701 cyclist movements per week, reductions of 20%, 24% and 34% in years 1 to 3 of the law[60].
6)
Census data shows reduced cycling levels for Australia as shown below[61] in table 7 comparing cyclists to pedestrians, (17 years and older). Prior to helmet legislation cyclist deaths were approximately 10% compared with pedestrians, in 2021 they were 33.6%.
Table 7 Australia – fatalities (17 years and older[62])
|
1981 |
1986 |
1991 |
1996 |
2001 |
2006 |
2011 |
2016 |
2021 |
|
|
Cyclists – C |
33 |
39 |
35 |
37 |
34 |
39 |
32 |
29 |
39 |
|
Pedestrians. – P |
491 |
423 |
292 |
306 |
253 |
197 |
172 |
170 |
116 |
|
C/P% |
6.7 |
9.2 |
11.9 |
10.2 |
13.4 |
16.2 |
18.6 |
17.0 |
33.6% |
|
% cycling to work |
1.56* |
1.68* |
1.50* |
1.24* |
1.21* |
1.24* |
1.29* |
1.24* |
0.7*** |
|
% walking to work |
4.4** |
3.9** |
3.9** |
3.5** |
3.5** |
4.0** |
3.9* |
4.2* |
2.5*** |
* national data
** data from main cities
*** https://www.abs.gov.au/articles/australias-journey-work
7)
Evidence of continued discouragement includes the fact that helmets were cited as the main barrier to using the Melbourne Bike Scheme[63].
Australia serious injury data,
(refer Clarke and Gillham 2019 study, Table 2 )
Table 8
|
1990 |
2003/04 |
2005/06 |
2008/09 |
2012/13 |
2021/22 |
|
|
Cyclists |
7520 |
7929 |
8814 |
9577 |
10098 |
14796* |
|
Pedestrians |
5048 |
3715 |
3779 |
3686 |
3823 |
3510 |
|
C/P (actual) |
1.49 |
2.13 |
2.33 |
2.60 |
2.64 |
4.21 |
|
Cycling level % proportional |
100 |
60 |
59 |
58 |
N/A |
N/A |
|
Equivalent C/P – estimate |
1.49 |
3.55 |
3.95 |
4.47 |
N/A |
N/A |
* https://www.aihw.gov.au/reports/injury/transport-accidents#typestransports
Senate Hearing
The Senate hearings on the cycle helmet topic[64] interviewed many people and had many submissions. Extra comment from the Chair stated[65], ‘During the course of the hearing, and based on available data, it became clear MHL have undermined cycling participation rates. Attempts to argue to the contrary, especially given evidence from around the world, were not at all persuasive’. Data for New Zealand, where they published estimated hours cycled shows a reduction in average hours cycled per person of between 41.24% and 59.32% and an increased accident/injury risk based on per million hours cycled of between 34.96% and 121.31%[66]. Australian evidence shows the helmet laws had both short- and long-term effects in reducing cycling levels.
Post Concussion report
Moore et al (2020) reported on 28 adult cyclist post-concussion syndrome (PCS) cases (20 helmeted v 8 non-helmeted) that “The mean duration of PCS for helmet wearers was 22.9 months, and 16.8 months for patients not wearing a helmet at the time of concussion (p=0.41)”, and ‘We found that patients with one or more previous concussions had a greater duration of symptoms compared with those with no previous concussions (p=0.042). This is consistent with our previous study showing those with previous concussions have a longer recovery period. Covassin et al also found that athletes with previous concussions took longer to recover compared with those without a concussion history’. From 28 cases, 8 had no previous concussions, with 20 cases having more than one concussion. At least 12 helmeted had more than one concussion
Genda considerations
A USA study, Feler 2020[67] compared the outcome from helmet wearing for male v female and stated,
Results In total, 18 604 patients of average age 48.1 were identified, and 18% were female. Helmet use was greater in females than males (48.0% vs 34.2%, p<0.001). Compared with helmeted males, helmeted females had greater rates of serious head injury (37.7% vs 29.9%, p<0.001) despite less injury overall. In sex-disaggregated models, helmet use reduced odds of intracranial haemorrhage and death in males (p<0.001) but not females. In sex-combined models, helmets conferred to females significantly less odds reduction for severe head injury (p=0.002), intracranial bleeding (p<0.001), skull fractures (p=0.001), cranial surgery (p=0.006) and death (p=0.017). There was no difference for cervical spine fracture.
The study details high levels of alcohol use by male non-helmeted cyclists, 27.4% compared to 4.6% for helmeted, and it is likely this affected the outcomes, making comparing helmeted to non-helmeted unreliable. The overall result from helmet use for females was negative. Australian data shows they had a lower risk than males and adding helmets appears to increase their risk levels. In boxing they require female to wear helmets but not males[68], mainly because of insufficient data on females.
Health benefits of cycling
The health benefits of cycling far outweigh the risks involved, reportedly by between 13 to 1 and 415 to 1[69]. The health benefits involve the immune system, muscles, the skeleton system, spinal diseases and back pain, joint protection, balance and equilibrium, mental stress, oxygen and circulation, heart and cardiovascular diseases, body weight, adiposity and obesity, body fat and hypercholesterol, blood pressure, cancer, stamina, beauty and attractiveness, physical workout, quality of life, and additionally if people cycle and not drive environmental benefits[70].
Australia 2018, overweight (including obesity) was responsible for:
55% of type 2 diabetes disease burden.
51% of hypertensive heart disease.
49% of uterine cancer.
43% of gout.
42% of chronic kidney disease.
Overweight (including obesity) contributed to around 16,400 deaths (10% of all deaths) (AIHW 2019).(compared with reported, 35[71] – 42 cyclist deaths[72])
The total disease burden attributable to overweight (including obesity) in 2018 was 2.2 times greater in the lowest socioeconomic group compared with the highest socioeconomic group (AIHW 2019)[73]. Clarke 2015 provided an evaluation of Australia’s bicycle helmet law and reported the disadvantages in health terms outweighed the potential benefits by 109 to 1[74]. Cycling UK[75] stated: However Cycling UK is not only concerned about the harmful effects of mandatory helmet use. By creating exaggerated perceptions of the risks of cycling, even voluntary helmet promotion campaigns have been found to deter some people from cycling. Given that the health benefits of cycling outweigh the risks by around 20:1 (one recent study put it at 77:1), it can be shown that only a very small reduction in cycle use is needed for helmet promotion (let alone helmet laws) to shorten more lives than helmets themselves could possibly save, regardless of how effective helmets might be.
Research from Australia has claimed, ‘a 10% reduction in physical inactivity would result in 6,000 fewer incident cases of disease, 2,000 fewer deaths’[76].
Fines and sentences
Legislation started in Victoria on 1 July 1990 with penalty fines of $15 for not wearing cycle helmets. Exemptions from the legal requirement are sometimes allowed on medical or religious grounds. In the first 12 month 19,229 fines were issued in Victoria, 20314 in 1997, 15,950 in 1999, and about 20,000 in 2003. In the three years leading up to 30 June 2021, the Magistrates’ Court, had 393 charges of cyclists failing to wear an approved bike helmet were sentenced. The most common sentence for a charge of this offence was a fine, court cases can impose higher fines. (46.1%, or 181 of 393 charges). In 9 cases a prison sentence was applied[77]. In 2023 the penalty fines for not wearing a helmet are $240, much higher than NT or WA[78]. To keep pace with inflation the $15 fine level should be about $35 in 2023.
For New South Wales concerns have been expressed about the high levels of fines,[79]Julia Quilter, Associate Professor of Law, University of Wollongong and Russell Hogg, Adjunct Professor, School of Justice, Queensland University of Technology ‘Cycling is often held up as a model of healthy and sustainable urban transport. So why have bike laws become more, not less, draconian? Our ongoing research shows mandatory helmet laws have become a tool of disproportionate penalties and aggressive policing’. And ‘The penalty for riding without a helmet is now ludicrously excessive. Proportionality between penalty and offence has been lost. The goal is meant to be harm reduction. Piling on the fines does more harm than good’.![]()
Legal aspects
The right to health is part of the Australian Constitution[80]. It has been recognised that cycling has a significant impact on fitness and mental health[81].
The overall function of government is to act in the best interest of the population and to provide safeguards to ensure legislation is appropriate. The Victoria Parliament introduced cycle helmet law without assessing the societal health effects from reducing cycling. Cyclist accident data for Victoria showed a significant increase for adults aged between 17 and 50 as helmet use increased and the Government failed to take full account of this. Government guidance on health states[82],
The right to health is the right to the enjoyment of the highest attainable standard of physical and mental health.
The right to health comes under Article 12(1) of the International Covenant on Economic, Social and Cultural Rights (ICESCR).
With the reported health benefits of cycling far outweighing the risks involved, reportedly by between 13 to 1 and 415 to 1[83] and with cycle helmet legislation discouraging a proportion of people from cycling, estimated at 30% or more[84], and with the risk of a higher accident rate associated with helmet wearing, the legislation fails to be in keeping with the right to health.
Many people cycle for exercise, enjoyment, fun, commute, shopping, educational and making it has hassle free and enjoyable as possible is very important. With helmet law and enforcement comes police involvement and social pressure to conform with the law. The wearing rate in Victoria prior to legislation was estimated at 35.9%, meaning approximately 64% of the population preferred to cycle without wearing a helmet. About 40% of hours cycled were in regional areas with lower wearing rates.
Having to wear a helmet makes cycling less convenient, especially for short rides. With police involvement, those preferring to cycle without one, are subject to the risk of being stopped and fined or appear in court. Children are under pressure to wear them, or their parents may be fined. Some parents may prefer to avoid the risk of being fined and not encourage their children to cycle. Some schools may also add pressure to children to conform. The situation detracting from the enjoyment for those wishing to cycle without wearing a helmet. Thus, impacting on their right to health i.e. ‘The right to health is the right to the enjoyment of the highest attainable standard of physical and mental health’.
The actual risk level from cycling varies from minor to fatal. Reportedly about 30% of Australian may cycle and this equates to about 8 million people and there are about 40 deaths annually, this roughly equates to about 1 in 200,000. If cycling for 50 years in a lifetime, 1 in 4000 lifetimes. Table 7 above shows the risk to cyclists compared with pedestrians over a 40 year period, including the period of helmet promotion and legislation, with a result of a 500% increase in risk compared to pedestrians, 33.6/6.7 = 5.01. The risk of serious injury for cyclists has also increased, refer Table 8, 7520 to 14796, C/P value increased from 1.49 to 4.21.
A NSW judge, after hearing evidence about cyclist Sue Abbott, agreed that the helmet law was unnecessary,[85] stating; “I frankly don’t think there is anything advantageous and there may well be a disadvantage in situations to have a helmet – and it seems to me that it’s one of those areas where it ought to be a matter of choice.” An issue arose concerning costs that resulted in goods being confiscated from Mrs Abbott’s home[86].
Discussion
In 1990 the Minister for Transport for Victoria stated, ‘Bicycling has an important role in transport, and is to be encouraged as the most energy efficient travel mode producing minimal effects on the environment, and as a mode which has positive effects on personal health and recreation’. The Parliament of Victoria introduced cycle helmet legislation in 1990 requiring helmets be worn with low level fines ($15) for those not complying and allowing for exemptions in suitable circumstances. This followed from 10 years of helmet promotion. Parliament was responsible for monitoring any consequences. There were annual surveys by Vic Roads from 1983 to 1991 but they did not continue, and Parliament should have ensured a full assessment for several years. In 1991 surveys showed the helmet law had discouraged cycling, the opposite to encouraging it. The Vic Roads surveys may have been stopped to help limit the evidence of reduced cycling stemming from the helmet law. For Australia Clarke claimed, ‘For the 0-16 age group, by 2001 cycling levels seem to have halved and by 2011 were down even further, with an approximate 80% reduction’. Data from New Zealand with an almost identical law and data on hours cycled shows a reduction for the age group 5-17 years from 1989/90 to 2011/14 of 81.7%. For Melbourne, cyclists aged 5-18 reportedly cycled 17.8 billion seconds per week pre law in 1990[87] and this dropped by 36% to 11.3 billion seconds by 1992. Estimating the population size for the 5-18 age group in 1990 to be about 600,000, this would equate to approximately 30,000 / 34,000 seconds per week for each person, or about eight hours per week on average. Garrard reported that Melbourne children aged 10-14 in the 1994-99 period averaged 26km per year[88] and this translated to about 400 seconds per week[89] or 7 minutes. In Victoria, the number of children cycling to school halved between 1985 and 2001[90].
Prior to the law being introduced, probably less than 36% (Victoria) where wearing helmets of their own accord and more than 64% not wearing (In the Melbourne area, approximately 41% wearing and 59% not). Melbourne surveys in 1991 shows a 36% drop in the number cycling, i.e. more than half of the non-wearing rate of 59% (Fig 2). The major effect of the law was therefore to discourage cycling. Regional areas had lower wearing rates and a proper assessment of the discouraging effects was not provided, however accident data suggests a larger percentage reduction in rural areas. Vic Roads surveys for 1991 reported by Morgan et al shows a drop for adult commuters from 5162 to 3226, a 37.6% reduction and also a drop for children from 994 to 484, a 51.4% reduction[91]. Prior to helmet legislation from 1986-1989, the proportion of people cycling in general was increasing by 10% -12% per year[92].
The 1991 helmet petition to Parliament expressed concerns about helmet use increasing the overall accident rate, that Parliament failed to act on. Research from Victoria and around the world has shown helmet use leads to a higher accident rate per million hours cycled, connected with a higher fall off rate. The reasoning for the legal requirement was based on the belief that helmets would provide a positive safety outcome, with no regard to any negative health consequences due to discouraging cycling. They expected income from about 3000 fines per year. In the first 12 month 19,229 fines were issued, 20314 in 1997, 15,950 in 1999, and about 20,000 in 2003. Each year there has been a high level of police involvement, contributing to discouraging cycling.
The evidence for the belief in helmets was largely based on comparison studies, motorcyclists v cyclists, from comparing cyclists wearing helmets to those not wearing or from comparing head injury rates as helmet use increased. In 1982 McDermott and Klug examined data for the period 1975 to 1980 and reported skull fractures for pedal cyclists exceeded those of motorcyclists in Victoria, however, the 181 pedal cyclist fatalities compared to 497 for motorcyclists/pillion passengers [93]. Per hour of travel motorcyclists had about 16 times the fatality risk of cyclists[94]. The number of hours cycling in Victoria was several times higher than the number of hours motorcycling, so that the comparison had a limited basis for promoting helmets. Following the McDermott and Klug report the Australian Medical Association (AMA) in 1983 adopted the policy of compulsory helmet wearing for pedal cyclists. Comparing cyclists wearing helmets to those not also has major problems, (see Table 6), as there are major differences in behaviour and again provides little sound evidence. The Seattle study claiming helmets reduce head injuries by 85% was published in 1989. In 2015 it was reported the study overestimated their value by 400%. Comparing head injury rates as helmet use increased in the early 1980’s also has issues because TAC data shows higher rates of head injury for younger cyclists and bicycle safety education was on going from about 1983, encouraging safer riding practices and cycling levels for children may have changed because the number of registered motor vehicles increased by 24% between 1980 and 1985, possibly contributing to less hours cycled by children.
From 1989 to 1992 overall road deaths in Victoria reduced from 777 to 396, a 49% reduction. In 1989 35,750 persons were injured. In the 12 months to the end of May 1993 22,216 persons were injured – 38% decrease. In 1989, 22.8% of vehicles were found to be exceeding the threshold limit. The proportion of speeding drivers fell markedly to 3.8% in June 1993. TAC data shows reduced head injuries for pedestrians of 23% from 1989 to 1992. For cyclists head injuries reduced by 33%[95]. Indications are that cycling levels reduced by more than 30%, with the highest head injury group, teenagers reducing by 45% to 48%. In 2013 Vic Roads reported ‘Two years after the legislation was introduced, there was a 16% reduction in head injuries in metropolitan Melbourne and a 23% reduction in head injuries throughout Victoria’. The reduction in head injuries to cyclists appear to be mainly due to reductions in cycling levels, especially for teenagers and improvements in road safety via less speeding and fewer cases of drink driving. A letter [96]to the Medical Journal of Australia shows the major reductions in road casualties for Victoria from 1990 to 1992 that would have contributed to reduced head injuries for cyclists. Monash University published several studies claiming higher reductions in head injuries, however the classification for head injury and hospital admission criteria may have changed.
Key points
1)
Evidence prior to 1990 in support of helmet use was weaker than it first appeared.
2)
Cyclist accident data for Victoria 1984/88 showed a significant increase (119%) for adults aged between 17 and 50 as helmet use increased and the Government failed to take full account of this.
3)
The risk of a cycling fatality for the average person is estimated to be low, approximately 1 in 4000 lifetimes (0.025%) and for a serious head injury about 1%.
4)
Research has reported that the health benefits of cycling far outweigh the risks involved, reportedly by between 13 to 1 and 415 to 1[97].
5)
The Victoria Government failed to ensure statewide comparable surveys to be able to accurately assess cycling levels. Available evidence suggests children’s cycling reduced substantially. Research suggests the helmet law discouraged cycling by more than 30%. Potentially about half of non-wearers cycled less. Melbourne surveys, pre to post helmet law, showed 30 more teenagers wearing helmets compared with 623 fewer cycling, a drop of 48%, with 20 fewer cycling for each extra one wearing a helmet[98]. Despite a large population increase and extra cycling infrastructure. Census data on cycling to work in Victoria shows cycling reduced from 24,022 in 1986 to 22,267 in 2021[99].
6)
Clarke 2015 provided an evaluation of Australia’s bicycle helmet law and reported the disadvantages in health terms outweighed the potential benefits by 109 to 1[100]. The evaluation assumed helmets would prevent some head injuries but the overall effect on health was negative.
7)
The level of penalty notices for not wearing started at $15 in 1990 and to follow inflation would be approximately $35 in 2023, however it is $240, a massive unjust increase. From court cases some prison sentences are imposed. The pre law assessment expected income from about 3000 fines per year. In the first 12 month 19,229 fines were issued, 20314 in 1997, 15,950 in 1999, and about 20,000 in 2003. Each year there has been a high level of police involvement, contributing to discouraging cycling in the longer term.
8)
Cycling hospitalisions in Australia has increased by 97% from 1990 to 2021/22, and research has reported that helmet use increases the accident rate by between 14% and 40%[101].
9)
The right to health is part of the Australian Constitution[102]. It has been recognised that cycling has a significant impact on fitness and mental health[103], .[104] The Victoria Parliament introduced cycle helmet law without assessing the societal health effects from reducing cycling and increased accident risk. Government guidance on health states[105],
The right to health is the right to the enjoyment of the highest attainable standard of physical and mental health.
The right to health comes under Article 12(1) of the International Covenant on Economic, Social and Cultural Rights (ICESCR).
10)
Many people cycle for exercise, enjoyment, fun, commute, shopping, educational and making it has hassle free and enjoyable as possible is very important. With helmet law and enforcement comes police involvement and social pressure to conform with the law. Additionally, it results in an increased accident risk. Thus, impacting on people’s right to health i.e. ‘The right to health is the right to the enjoyment of the highest attainable standard of physical and mental health’.
Conclusions
Survey and census data show the helmet law discouraged cycling, especially for teenagers. The available evidence for Victoria shows a negative outcome for health, safety and social aspects with high level fines for not wearing cycle helmets. Evidence shows the health benefits of cycling far exceeds the injury consequences; therefore, the helmet law is having an overall negative effect on the health of people in Victoria and Australia.
The evidence for mandatory helmet use is not at all strong to warrant imposing fines, having regard to justice and human rights, and the individual and society. Cycling has not a high fatality risk or a high serious injury risk rate and according to research, the health benefits easily exceed the risks. If the risk level for the type of cycling undertaken is very high, then potentially it may be of benefit to wear helmets, however the risk level is generally low, as per the typical cyclist, then the added risks from helmets can increase the overall accident risk with more impacts and extra falls. The helmet laws in Victoria and in other parts of Australia are incompatible with the Constitution and human right of the enjoyment of the highest attainable standard of physical and mental health. Courts and judges should follow the principles of justice and the Constitution and where the law conflicts, with questionable requirements based on unreliable methods and unjust high-level fines, and jail terms, they should use their authority and decide based on justice and health for individuals. There is no sound basis for having the helmet law and it is not necessary. The Government of Victoria has failed in its duty of care to properly monitor and fully evaluate the consequences of the helmet law. The helmet law should be repealed. Plans to improve safety via education and cycle training should be strengthened.
Colin Clarke,
Private Researcher Colin Clarke (0000-0002-0685-9874) (orcid.org)
Email colinclarkecycling@hotmail.co.uk
Appendix A

-
https://www.sentencingcouncil.vic.gov.au/sacstat/magistrates-court/sr17-41-256-1-cyclist-fail-to-wear-an-approved-bike-helmet-mc.html ↑
-
https://www.aph.gov.au/About_Parliament/Senate/Powers_practice_n_procedures/Odgers_Australian_Senate_Practice/Chapter_20 ↑
-
Road Fatality Statistics Australia, 1992 FORS ↑
-
Safe roads for Children, Social Development Committee, Parliament of Victoria 1987. ↑
-
Traffic Accident Commission data provided to C Clarke 1993 ↑
-
Victorian Bicycling Strategy; Vic Roads, Australia 1990. ↑
-
Victorian Injury Surveillance System, Hazard Vol 6, Dec 1990 ↑
-
BICYCLE HELMET USAGE RATES IN VICTORIA 1983-1990 Vic Roads
-
Victorian Bicycling Strategy; Vic Roads, Australia 1990. ↑
-
Finch C, Heiman L, Neiger D; Bicycle Use and Helmet Wearing Rates in Melbourne, 1987 to 1992: The Influence of the Helmet Wearing Law; Report 45. Melbourne (Vic): MUARC, 1993. ↑
-
Robinson DL; Head injuries and bicycle helmet laws; Accid Anal Prev, 28, 4: p 463-475, 1996
-
Shepherd R, Helmet law discourages cycling, Australian Cyclist, Oct 1991 ↑
-
Victoria, Department of Transport, fees https://www.vicroads.vic.gov.au/safety-and-road-rules/road-rules/penalties/fines#fines ↑
-
https://www.cla.asn.au/News/bike-helmet-fines-are-enough-to-do-your-head-in/#:~:text=Professors%20Julia%20Quilter%20and%20Russell,Fair%20cop%20or%20unjust%20gouge%3F ↑
-
https://profile.id.com.au/australia/travel-to-work?WebID=110#:~:text=Victoria&text=On%20Census%20day%202021%20in,rode%20a%20bike%20or%20walked. ↑
-
http://cycle-helmets.com/senate-inquiry-comment.html ↑
-
Robinson D, Submission to Inquiry on Personal Choice and Community Safety, WA https://www.parliament.wa.gov.au/Parliament/commit.nsf/luInquiryPublicSubmissions/B6700C5BF56F2BB1482583280007ED13/$file/cs.ccs.089.181005.sub.Cycle-Safe.pdf ↑
-
https://new.parliament.vic.gov.au/hansard , PETITIONS SITTINGYEAR 1991, page 2531 ↑
-
Sullivan G, Wise A, Bicycle helmet usage rates in Victoria 1983 -1990, Vic Roads GR90-9 ↑
-
Lambert J. Number of cyclists, bicycle trips and bicyclist accident reports in Victoria, 1986-1989. Vic Roads internal report, May 1990. ↑
-
Newstead S, Cameron M, Gantzer S, Finch C, 1994, ‘Bicycle head injuries in Victoria, Three years after the introduction of mandatory use’ report no 75 MUARC, 1994. ↑
-
Janssen EG, Wisemans JSHM; Experimental and mathematical simulation of pedestrian –vehicle and cyclist-vehicle accidents; Proceedings of the 10th International Technical Conference on Experimental Safety Vehicles, Oxford July 1985. ↑
-
Robinson DL; Head injuries and bicycle helmet laws; Accid Anal Prev, 28, 4: p 463-475, 1996 http://www.cycle-helmets.com/robinson-head-injuries.pdf ↑
-
Clarke CF, The Case against bicycle helmets and legislation, VeloCity Munich, 2007. http://www.ta.org.br/site/Banco/7manuais/colin_clarke_cycle_helmet.pdf ↑
-
Erke A, Elvik R. Making Vision Zero real: Preventing Pedestrian Accidents And Making
Them Less Severe, Oslo June 2007. page 28. https://www.toi.no/getfile.php/Publikasjoner/T%d8I%20rapporter/2007/889-2007/889-2007-nett.pdf ↑
-
Clarke CF, Gillham C,(2019) Effects of bicycle helmet wearing on accident and injury rates, GB National Road Safety Conference, November 2019 https://www.researchgate.net/publication/337367329_Effects_of_bicycle_helmet_wearing_on_accident_and_injury_rates ↑
-
https://www.vicroads.vic.gov.au/safety-and-road-rules/cyclist-safety/wearing-a-bicycle-helmet ↑
-
Spaite DW, Murphy M, Criss EA, Valenzuela TD, Meislin HW, A prospective analysis of injury severity among helmeted and non helmeted bicyclists involved in collisions with motor vehicles. Journal of Trauma, 1991;31(11):1510-6 ↑
-
Bambach, M; Mitchell RJ, Grzebieta RH, Olivier J (April 2013). “The effectiveness of helmets in bicycle collisions with motor vehicles: A case-control study.“. Accid Anas and Prev. 53: 78–88. doi:10.1016/j.aap.2013.01.005. PMID 23377086. ↑
-
Whately S, Bicycle Crashes in the Austrian Capital Territories, CR 35, FORS, 1985, Table 25
http://www.infrastructure.gov.au/roads/safety/publications/1985/pdf/Bic_Crash_1.pdf accessed 11.1.2014 ↑
-
Dinh MM, Kastelein C, Hopkins R, Royle TJ, Bein KJ, Chalkley DR, Ivers R. Mechanisms, injuries and helmet use in cyclists presenting to an inner city emergency department. Emerg Med Australas. 2015 Aug;27(4):323-7. doi: 10.1111/1742-6723.12407. Epub 2015 May 4. ↑
-
Clarke CF, Evaluation of Australia’s bicycle helmet laws, The Sports Science Summit, O2 venue London UK http://www.cycle-helmets.com/au-assessment-2015.pdf Presented 14 January 2015 ↑
-
Whately S, Bicycle crashes in the Australian Capital Territories, CR35,Federal Office of Road Safety, 1985. ↑
-
National Center for Statistics & Analysis (NCSA) data provided to C Clarke, 25 Aug 2023 ↑
-
Clarke CF, Weaknesses with a Meta-Analysis Approach to Assessing Cycle Helmets, 2017 https://trid.trb.org/view/1491227
-
A case-control study of the effectiveness of bicycle safety helmets (cyclehelmets.org) ↑
-
A case-control study of the effectiveness of bicycle safety helmets (cyclehelmets.org) ↑
-
Zeegers T, Overestimation of the effectiveness of the bicycle helmet by the use of odds ratios’ http://www.fietsberaad.nl/?lang=nl&repository=overestimation+of+the+effectiveness+of+the+bicycle+helmet+by+the+use+of+odds+ratios ↑
-
Teschke K, Koehoorn M, Shen H, et al. Bicycling injury hospitalisation rates in Canadian jurisdictions: analyses examining associations with helmet legislation and mode share. BMJ Open 2015;5:e008052. doi:10.1136/bmjopen-2015- 008052 ↑
-
Curnow B, A Scientific Evaluation; Bicycle Helmets, https://www.cyclehelmets.org/papers/p787.pdf ↑
-
StClair VJ, Chinn BP, (2007) Transport Research Laboratory. Assessment of current bicycle helmets for the potential to cause rotational injury (trb.org) )Accessed 18/02/2022) ↑
-
Webman R, Dultz LA, Simon RJ et al. Helmet use is associated with safer bicycling behaviors and reduced hospital resource use following injury. J Trauma Acute Care Surg 2013;75:877–81. ↑
-
Wachtel A, Lewiston D, Risk Factors for Bicycle-Motor Vehicle Collisions at Intersections http://www.bicyclinglife.com/Library/riskfactors.htm ↑
-
Airaksinen N, Luthje P, Nurmi-Luthje I. Cyclist injuries treated in Emergency Department (ED): Consequences and costs in South- Eastern Finland in an area of 100 000 inhabitants. Association for the Advancement of Automotive Medicine 54th Annual Scientific Conference; 17October 2010. Las Vegas, NV, Association for the Advancement of Automotive Medicine, 2010. ↑
-
Crocker P, Zad O, Milling T, Lawson KA, Alcohol, bicycling, and head and brain injury: a study of impaired cyclists’ riding patterns, American Journal of Emergency Medicine, 2010;28(1):68-7 ↑
-
Harada MY, Gangi A, Ko A et al. Bicycle trauma and alcohol intoxication. Int J Surg (Lond) 2015;24:14–19. ↑
-
Sethi M, Heidenberg J, Wall SP et al. Bicycle helmets are highly protective against traumatic brain injury within a dense urban setting. Injury 2015;46:2483–90. ↑
-
Dinh MM, Kastelein C, Hopkins R, Royle TJ, Bein KJ, Chalkley DR, Ivers R. Mechanisms, injuries and helmet use in cyclists presenting to an inner city emergency department. Emerg Med Australas. 2015 Aug;27(4):323-7. doi: 10.1111/1742-6723.12407. Epub 2015 May 4 ↑
-
Gaudet L, Romanow NTR, Nettel-Aguirre A, Voaklander D, Hagel, Rowe BH,
The epidemiology of fatal cyclist crashes over a 14-year period in Alberta, Canada, BMC Public Health 201515:1142 DOI: 10.1186/s12889-015-2476-9
http://bmcpublichealth.biomedcentral.com/articles/10.1186/s12889-015-2476-9 ↑
-
Forbes AE, Schutzer-Weissmann J, Menassa DA, Wilson MH (2017) Head injury patterns in helmeted and non-helmeted cyclists admitted to a London Major Trauma Centre with serious head injury. PLoS ONE 12(9): e0185367. https://doi.org/10.1371/journal.pone.0185367 ↑
-
Li G, Baker SP, Smialek JE, Soderstrom CA. Use of alcohol as a risk factor for bicycling injury. https://www.ncbi.nlm.nih.gov/pubmed/11180732/ ↑
-
Twisk DAM, ∗, Martine Reurings M, An epidemiological study of the risk of cycling in the dark:
The role of visual perception, conspicuity and alcohol use, Accid Anal and Prev. 60 (2013) 134– 140 ↑
-
Sethi M, Heidenberg J, Wall SP et al. Bicycle helmets are highly protective against traumatic brain injury within a dense urban setting. Injury 2015;46:2483–90. ↑
-
McGuire L and Smith N,(2000) Cycling safety: injury prevention in Oxford cyclists, Injury Prevention 2000;6:285–287 ↑
-
Robinson DL; Head injuries and bicycle helmet laws; Accid Anal Prev, 28, 4: p 463-475, 1996
-
Morgan M, Sullivan G, Nassau F, Rogerson P Peberdy P, Anderson A, Leicester P, Bicycle helmet usage rates in Victoria;1990 -1991, Vic Roads Report GR91-9 ↑
-
Robinson DL; Head injuries and bicycle helmet laws; Accid Anal Prev, 28, 4: p 463-475, 1996
-
Hutchinson, TP, Kloeden, CN, Long, AD, Bicycle crashes in South Australia, 2008 https://digital.library.adelaide.edu.au/dspace/bitstream/2440/49072/2/hdl_49072.pdf (2008, accessed 20 February 2021). ↑
-
Robinson D, Submission to Inquiry on Personal Choice and Community Safety, WA https://www.parliament.wa.gov.au/Parliament/commit.nsf/luInquiryPublicSubmissions/B6700C5BF56F2BB1482583280007ED13/$file/cs.ccs.089.181005.sub.Cycle-Safe.pdf ↑
-
Clarke CF, Is cycle helmet promotion warranted, July 2022 Edinburgh Napier University.
https://www.researchgate.net/publication/361798342_Is_cycle_helmet_promotion_warranted ↑
-
Road trauma Australia 2016 statistical summary, https://bitre.gov.au/publications/ongoing/files/Road_Trauma_Australia_2016_Web.pdf ↑
-
Fishman, E., et al., Barriers to bikesharing: an analysis from Melbourne and Brisbane. Journal of Transport Geography, 2014. 41: p. 325-337. ↑
-
https://www.cycle-helmets.com/leyonhjelm-helmets.html ↑
-
https://www.aph.gov.au/Parliamentary_Business/Committees/Senate/Economics/Personal_choice/Interim%20report%20d/c05 ↑
-
Clarke CF, Gillham C,(2019) Effects of bicycle helmet wearing on accident and injury rates, GB National Road Safety Conference, November 2019 https://www.researchgate.net/publication/337367329_Effects_of_bicycle_helmet_wearing_on_accident_and_injury_rates ↑
-
Feler J, Maung AA, O’Connor R, et al Sex-based differences in helmet performance in bicycle trauma
J Epidemiol Community Health 2021;75:994-1000 ↑
-
https://globalsportmatters.com/health/2019/08/27/aiba-drops-headgear-male-amateur-boxers-female-fighters-wear-them/ ↑
-
Cycling UK,(2017) Health and Cycling https://www.cyclinguk.org/campaigning/views-and-briefings/health-and-cycling (Accessed 1 May 2022) ↑
-
https://s23705.pcdn.co/wp-content/uploads/2021/05/Bicycle-Network-Bike-rider-fatality-report_2020.pdf ↑
-
https://www.statista.com/statistics/992270/total-number-cyclist-deaths-australia/ ↑
-
https://www.aihw.gov.au/reports/overweight-obesity/overweight-and-obesity/contents/overweight-and-obesity ↑
-
Clarke CF, Evaluation of Australia’s bicycle helmet laws, The Sports Science Summit, O2 venue London UK http://www.cycle-helmets.com/au-assessment-2015.pdf Presented 14 January 2015 ↑
-
Cycling UK,(2017) Health and Cycling https://www.cyclinguk.org/campaigning/views-and-briefings/health-and-cycling (Accessed 1 May 2022) ↑
-
Cadilhac, D.A., Cumming, T.B., Sheppard, L. et al. The economic benefits of reducing physical inactivity: an Australian example. Int J Behav Nutr Phys Act 8, 99 (2011). https://doi.org/10.1186/1479-5868-8-99 9 ↑
-
https://www.sentencingcouncil.vic.gov.au/sacstat/magistrates-court/sr17-41-256-1-cyclist-fail-to-wear-an-approved-bike-helmet-mc.html ↑
-
https://www.reidcycles.com.au/blogs/news/fines-for-not-wearing-a-bike-helmet-in-each-australian-state ↑
-
https://www.uow.edu.au/media/2019/over-the-top-policing-of-bike-helmet-laws-targets-vulnerable-riders.php#:~:text=Riding%20a%20bike%20without%20a,million%20were%20issued%20to%20cyclists. ↑
-
https://www.ag.gov.au/rights-and-protections/human-rights-and-anti-discrimination/human-rights-scrutiny/public-sector-guidance-sheets/right-health ↑
-
British Medical Association, Cycling towards Health and Safety, 1992 ↑
-
Right to health | Attorney-General’s Department (ag.gov.au) ↑
-
Cycling UK,(2017) Health and Cycling https://www.cyclinguk.org/campaigning/views-and-briefings/health-and-cycling (Accessed 1 May 2022) ↑
-
Clarke CF, Evaluation of Australia’s bicycle helmet laws, The Sports Science Summit, O2 venue London UK http://www.cycle-helmets.com/au-assessment-2015.pdf Presented 14 January 2015 ↑
-
Heady freedom as judge agrees helmet laws are unnecessary http://www.smh.com.au/nsw/heady-freedom-as-judge-agrees-helmet-laws-are-unnecessary-20100827-13vz2.html accessed 25.9.2014 ↑
-
The only proven thing helmets protect us from are fines
http://www.theguardian.com/environment/bike-blog/2012/nov/13/helmets-australia accessed 21.11.2014 ↑
-
Finch C, Heiman L, Neiger D; Bicycle Use and Helmet Wearing Rates in Melbourne, 1987 to 1992: The Influence of the Helmet Wearing Law; Report 45. Melbourne (Vic): Accident Research Centre, Monash University, 1993. ↑
-
Garrard J. Active transport: Children and young people, An overview of recent evidence, Dec 2009, Table 1
http://www.chpcp.org/resources/Active_transport_children_and_young_people_FINAL.pdf
accessed 5.8.2014 ↑
-
Ironmonger, D.S and Norman, P (2007) “Travel Behaviour of Women, Men and Children:What Changes and What Stays the Same?”
http://www.transport.vic.gov.au/__data/assets/pdf_file/0007/31210/Travel-behaviour-of-WomenMenChildren_IATUR-paper.pdf ↑
-
Hume C, What influences whether children walk or cycle to school?
http://www.deakin.edu.au/health/cpan/reports-downloads/02-book-reports/files/Influences%20to%20childrens%20travels%20to%20school.pdf accessed 30.9.2014 ↑
-
Morgan M, Sullivan G, Nassau F, Rogerson P Peberdy P, Anderson A, Leicester P, Bicycle helmet usage rates in Victoria;1990 -1991, Vic Roads Report GR91-9. ↑
-
Lambert J. Number of cyclists, bicycle trips and bicyclist accident reports in Victoria, 1986-1989. Vic Roads internal report, May 1990. ↑
-
McDermott FT, Klug GL Differences in head injuries of pedal cyclist and motorcyclist casualties in Victoria. The Medical Journal of Australia[1982, 2(1):30-32 ↑
-
Clarke CF, The Case against bicycle helmets and legislation, VeloCity Munich, 2007. http://www.ta.org.br/site/Banco/7manuais/colin_clarke_cycle_helmet.pdf ↑
-
TAC data provided to C Clarke 1993. ↑
-
North B, Oatey P, Jones N, Simpson D, Head injuries from road accidents – a diminishing problem? MJA Vol 158, March 151993. ↑
-
Cycling UK,(2017) Health and Cycling https://www.cyclinguk.org/campaigning/views-and-briefings/health-and-cycling (Accessed 1 May 2022) ↑
-
Robinson DL; Head injuries and bicycle helmet laws; Accid Anal Prev, 28, 4: p 463-475, 1996
-
https://profile.id.com.au/australia/travel-to-work?WebID=110 ↑
-
Clarke CF, Evaluation of Australia’s bicycle helmet laws, The Sports Science Summit, O2 venue London UK http://www.cycle-helmets.com/au-assessment-2015.pdf Presented 14 January 2015 ↑
-
Clarke CF, Gillham C,(2019) Effects of bicycle helmet wearing on accident and injury rates, GB National Road Safety Conference, November 2019 https://www.researchgate.net/publication/337367329_Effects_of_bicycle_helmet_wearing_on_accident_and_injury_rates ↑
-
https://www.ag.gov.au/rights-and-protections/human-rights-and-anti-discrimination/human-rights-scrutiny/public-sector-guidance-sheets/right-health ↑
-
British Medical Association, Cycling towards Health and Safety, 1992 ↑
-
https://www.sustrans.org.uk/our-blog/get-active/2020/everyday-walking-and-cycling/why-cycling-and-walking-are-great-for-your-mental-health/ ↑
-
Right to health | Attorney-General’s Department (ag.gov.au) ↑